Oljeproduktionstoppen


Oljeproduktionstoppen, på engelska peak oil, är den tidpunkt då den maximala råoljeproduktionen är uppnådd, varefter den kommer att minska tills den hanterbara råoljan i praktiken tagit slut. Att denna punkt förr eller senare kommer att inträffa är oemotsägligt eftersom oljan är en ändlig resurs, men exakt när detta händer är omdebatterat.[1] Oljeproduktionen kan antas vara lika stor som konsumtionen, eftersom lagermängden är begränsad och med peak oil menas vanligen fallet då orsaken till minskad produktion är brist, inte minskad konsumtion. Brist på olja antas betyda stora prishöjningar och ekonomisk stagnation för konsumtionsländer.
Internationella energirådet har slagit fast att Peak Oil inträffade för konventionell råolja år 2006.[2] Enligt statsvetaren Björn Forsberg nåddes produktionstoppen för vanlig råolja år 2004.[3] USA:s krigsmakt räknar med en minskning av oljeproduktionen kring år 2015.[4] Organisationen ASPO, Association for the Study of Peak Oil and Gas hävdar att detta kommer att ske inom några år, medan andra (hit räknas de flesta oljebolag och regeringar) är mer optimistiska och räknar med att toppen kommer ungefär på 2030-talet. En rapport från 2007 av Kjell Alekletts forskargrupp beräknade med hjälp av gigantoljefält att peak oil skulle inträffa mellan 2008 och 2018, mestadels beroende på när det blev fred i Irak så att de oljefält som finns där kunde tas i produktion.[5] Hirschrapporten, februari 2005, spår svåra ekonomiska konsekvenser vid en oväntad produktionstopp.[6]
När det gäller nya oljefyndigheter nåddes toppen i början av 1960-talet, och för oljeproduktionen i länder utanför OPEC och forna Sovjetunionen passerades produktionstoppen ungefär år 2000.
Begreppet Peak oil lanserades av Romklubben[källa behövs] och fick sitt genombrott med rapporten Tillväxtens gränser som gavs ut år 1972.
Se även
- Carterdoktrinen
- Association for the Study of Peak Oil and Gas
- Kjell Aleklett
- M. King Hubbert
- Alternativa drivmedel
- Oljekrisen
Referenser
Fotnoter
- ^ Nationalencyklopedin: oljeproduktionstopp
- ^ http://sverigesradio.se/sida/artikel.aspx?programid=3345&artikel=4300014
- ^ Forsberg 2012, s. 26.
- ^ JOE 2010, s. 29.
- ^ Giant Oil Fields - The Highway to Oil: Giant Oil Fields and their Importance for Future Oil Production
- ^ ”Peaking Of World Oil Production: Impacts, Mitigation, & Risk Management”. Arkiverad från originalet den 28 mars 2010. https://web.archive.org/web/20100328071424/http://www.mnforsustain.org/oil_peaking_of_world_oil_production_study_hirsch.htm. Läst 14 april 2010.
Källor
- Forsberg, Björn (2012) [2012]. Omställningens tid. Tillväxtens slut och jakten på en hållbar framtid. Stockholm: Karneval. Libris 12455783. ISBN 978-91-85703-62-3.
- ”The Joint Operating Environment 2010” (på engelska) (PDF). United States Joint Forces Command. 2010. http://permanent.access.gpo.gov/lps121890/2010/JOE_2010_o.pdf. Läst 29 januari 2014.
| ||||||||||||||||||||||||||||||||||||||
Media som används på denna webbplats
World total oil production between 1960 and 2009.
Författare/Upphovsman: TomTheHand, Licens: CC BY-SA 3.0
In the process of creating Image:Oil Prices 1861 2007.svg, I realized what an incredible wealth of information is available on the Energy Information Administration's web site. The 1861–2007 graph uses yearly averages, and I couldn't think of a really satisfying way to incorporate the price jumps of the past couple of months. Anyway, I think it's alright for a graph of 150 years of history to wait until the year's end to incorporate its data.
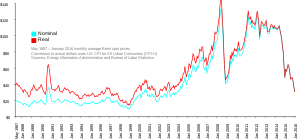
Instead, I've created this graph, which uses all available monthly average Brent spot prices from this EIA spreadsheet and the United States Consumer Price Index for All Urban Consumers (CPI-U), seasonally adjusted, from here (This is a direct link; but there may be a better one). The monthly numbers and limited date range give good detail, and coverage up to April 2008 shows the recent price jumps. It will be about a month before I can add May 2008, because it takes a little while for the Bureau of Labor Statistics to compile the CPI for the previous month..
I have no artistic talent whatsoever, so I know the color choices aren't great, but I have no eye for this stuff. I liked the blue and orange used by the 1861–2007 but I didn't want to use the same ones over again. I just chose a pair of RGB complementary colors. I am not married to this scheme; I'm happy to discuss alternatives. It's easy for me to make changes.
I will probably make more graphs from EIA data in the future. It's getting easier to work with SVG, though I know I still have a lot to learn.Hubbert peak graph showing the world's oil production peak.


