Oljepris

| Den här artikeln behöver källhänvisningar för att kunna verifieras. (2019-12) Åtgärda genom att lägga till pålitliga källor (gärna som fotnoter). Uppgifter utan källhänvisning kan ifrågasättas och tas bort utan att det behöver diskuteras på diskussionssidan. |
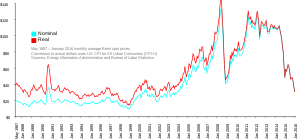
Oljepris är en term som vanligtvis avser spotpriset på råolja som handlas på New York Mercantile Exchange (NYMEX) eller priset på nordsjöolja (Brent) som handlas på Intercontinental Exchange (ICE). Nordsjöolja är det som kallas för Brent och den amerikanska oljan kallas för West Texas Intermediate (WTI).[1] Priset på olja anges i regel med USA-dollar per fat där ett fat (barrel) är ungefär 159 liter. Oljepriset på dessa spotmarknader anges som råolja av viss kvalitet, som levereras på ett visst ställe. För andra oljekvaliteter, och olja som levereras på andra ställen, betalas ett annat pris, som dock brukar bestämmas i relation till dessa standardiserade oljepriser. Oljan som exempelvis OPEC levererar bestäms i pris i relation till Brent- och WTI-olja.
Oljeprisets betydelse
Oljepriset är av stor ekonomisk betydelse, eftersom olja och andra petroleumprodukter kommer till så stor användning, bland annat för transporter, uppvärmning och som industriråvara. Konjunkturläget, den övergripande ekonomiska aktiviteten, påverkar därför efterfrågan på olja. Påverkan går även åt andra hållet. Förändringar i oljepriset som beror på ändrat utbud (exempelvis på grund av naturkatastrofer eller krig), kan påverka konjunkturen.
Priser i konsumentledet
Priser i konsumentledet på petroleumprodukter, såsom bensin och eldningsolja påverkas av oljepriset på spotmarknaden. Dock är detta inte den enda faktorn som påverkar dessa produkters pris. I många fall utgör skatt (70-90%) en större del av konsumentpriset än marknadspriset för råvaran och den direkta framställningskostnaden. Så är bland annat fallet för bensin i de flesta europeiska länder.
Se även
Referenser
Noter
- ^ ”Oljepris”. Arkiverad från originalet den 17 maj 2019. https://web.archive.org/web/20190517223954/http://www.binaryoptions.nu/olja.html. Läst 21 april 2020.
Media som används på denna webbplats
Författare/Upphovsman: Tkgd2007, Licens: CC BY-SA 3.0
A new incarnation of Image:Question_book-3.svg, which was uploaded by user AzaToth. This file is available on the English version of Wikipedia under the filename en:Image:Question book-new.svg
Författare/Upphovsman: TomTheHand, Licens: CC BY-SA 3.0
In the process of creating Image:Oil Prices 1861 2007.svg, I realized what an incredible wealth of information is available on the Energy Information Administration's web site. The 1861–2007 graph uses yearly averages, and I couldn't think of a really satisfying way to incorporate the price jumps of the past couple of months. Anyway, I think it's alright for a graph of 150 years of history to wait until the year's end to incorporate its data.
Instead, I've created this graph, which uses all available monthly average Brent spot prices from this EIA spreadsheet and the United States Consumer Price Index for All Urban Consumers (CPI-U), seasonally adjusted, from here (This is a direct link; but there may be a better one). The monthly numbers and limited date range give good detail, and coverage up to April 2008 shows the recent price jumps. It will be about a month before I can add May 2008, because it takes a little while for the Bureau of Labor Statistics to compile the CPI for the previous month..
I have no artistic talent whatsoever, so I know the color choices aren't great, but I have no eye for this stuff. I liked the blue and orange used by the 1861–2007 but I didn't want to use the same ones over again. I just chose a pair of RGB complementary colors. I am not married to this scheme; I'm happy to discuss alternatives. It's easy for me to make changes.
I will probably make more graphs from EIA data in the future. It's getting easier to work with SVG, though I know I still have a lot to learn.
