Lissajouskurva
| Den här artikeln behöver källhänvisningar för att kunna verifieras. (2024-06) Åtgärda genom att lägga till pålitliga källor (gärna som fotnoter). Uppgifter utan källhänvisning kan ifrågasättas och tas bort utan att det behöver diskuteras på diskussionssidan. |


En lissajouskurva (eller bowditchkurva) är avbildningen av det parametriska ekvationssystemet
Denna kurvfamilj studerades av Nathaniel Bowditch i 1815, och senare i detalj av Jules Antoine Lissajous.
Figurens utseende är starkt beroenden av kvoten a/b. När kvoten är 1 blir figuren en ellips, med specialfall för cirklar (A = B, δ = π/2 radianer) och linjer (δ = 0). En annan enkel lissajouskurva är parabeln (a/b = 2, δ = π/2). Andra kvoter resulterar i mer komplicerade kurvor, som enbart är slutna om a/b är ett rationellt tal.
Bakgrund
Nathaniel Bowditch undersökte 1815 lissajouskurvor genom att experimentera med pendlar som svängde samtidigt i en vågrörelse vinkelrätt mot varandra. 1857 gjorde den franska matematikern Jules Antoine Lissajous självständigt en mer ingående undersökning av dessa kurvor. Ett av experimenten gick ut på att skapa vibrationen i en spegel med hjälp av ljudvågor med olika frekvenser, och sedan belysa spegeln med ljus som i sin tur reflekterar olika mönster.
Exempel
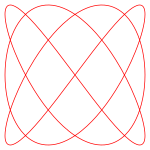
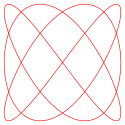
Nedan finns exempel av Lissajouskurvor med δ = π/2, ett udda naturligt tal a, ett jämnt naturligt tal b och |a – b| = 1.
a = 1, b = 2 (1:2) a = 3, b = 2 (3:2) a = 3, b = 4 (3:4) a = 5, b = 4 (5:4) a = 5, b = 6 (5:6) a = 7, b = 6 (7:6)
Skapa en lissajouskurva
Idag skapas de flesta lissajouskurvor med hjälp en av dator mekaniskt, med en så kallad harmonograf, vilket är ett hjälpmedel för att skapa en geometrisk bild med hjälp av pendlar. Det går även att skapa lissajouskurvor med hjälp av ett oscilloskop, se bild högst upp på sidan. Låt x vara representerad av kanal 1 och y kanal 2, där A är amplituden för kanal 1 och B kanal 2. Frekvensen till kanal 1 motsvaras av a och till kanal 2 av b vilket leder till att a/b är förhållandet mellan de två frekvenserna. δ representerar fasförskjutningen i kanal 1.
Tillämpningar
Lissajouskurvor har användningsområden i fysik, astronomi och i andra forskningssammanhang. Där man med hjälp av att syna kurvans utseende kan räkna till exempel frekvensen av det ena in-värdet då alla andra variabler är kända.
För att illustrera så man sätter a = b, A = B och δ och får en elliptisk kurva, vilket symboliserar en rät linje då δ = πn , där n är ett heltal. Då kan man avgöra fasförskjutningen med hjälp av skuggbilden av den elliptiska kurvan på ett oscilloskop enligt denna lista (LTI):
- δ = 0◦ om kurvan är en linje med positiv riktningskoefficient
- 0◦ > δ > −90◦ om kurvan rör sig motsols med positiv riktningskoefficient
- δ = −90◦ om kurvan rör sig motsols i en cirkel
- −90◦ > δ > −180◦ om kurvan rör sig motsols med negativ riktningskoefficient
- δ = −180◦ om kurvan är en linje med negativ riktningskoefficient
- −180◦ > δ > −270◦ om kurvan rör sig medsols med negativ riktningskoefficient
- δ = −270◦ om kurvan rör sig medsols i en cirkel
- −270◦ > δ > −360◦ om kurvan rör sig medsols med positiv riktningskoefficient

Externa länkar
 Wikimedia Commons har media som rör Lissajouskurva.
- Interactive Java Tutorial: Lissajous Figures on Oscilloskope National High Magnetic Field Laboratory
- Lissajous Curve at Mathworld
- HTML5 Canvas and Javascript based interactive version
- ECE 209: Lissajous Figures – a short wikified document that mathematically and graphically explains Lissajous curves for LTI systems and gives an oscilloscope procedure that uses them to find system phase shift
Media som används på denna webbplats
Författare/Upphovsman: Tkgd2007, Licens: CC BY-SA 3.0
A new incarnation of Image:Question_book-3.svg, which was uploaded by user AzaToth. This file is available on the English version of Wikipedia under the filename en:Image:Question book-new.svg
Författare/Upphovsman: Alessio Damato, Licens: CC BY-SA 3.0
A Lissajous curve, that can be expressed in parametric form as:
with , and . I created it with the following GNUplot code:
set samples 5000
set terminal svg
set output "Lissajous_curve_3by4.svg"

# plotting within a square
set size square

# remove most of information from the picture
set noxtic
set noytic
set key off

# plot
set parametric
a=3
b=4
delta=pi/2
plot [0:2*pi] sin(a*t + delta),sin(b*t) with lines linewidth 2
and then I post-processed with Inkscape
Författare/Upphovsman: Alessio Damato, Licens: CC BY-SA 3.0
A Lissajous curve, that can be expressed in parametric form as:
Författare/Upphovsman: Alessio Damato, Licens: CC BY-SA 3.0
A Lissajous curve, that can be expressed in parametric form as:
with , and . I created it with the following GNUplot code:
set samples 5000
set terminal svg
set output "Lissajous_curve_1by2.svg"
# plotting within a square
set size square

# remove most of information from the picture
set noxtic
set noytic
set key off
unset border

# plot
set parametric
a=1
b=2
delta=pi/2
plot [0:2*pi] sin(a*t + delta),sin(b*t) with lines linewidth 2
and then I post-processed with Inkscape
Författare/Upphovsman: Alessio Damato, Licens: CC BY-SA 3.0
A Lissajous curve, that can be expressed in parametric form as:
with , and . I created it with the following GNUplot code:
set samples 5000
set terminal svg
set output "Lissajous_curve_5by4.svg"

# plotting within a square
set size square

# remove most of information from the picture
set noxtic
set noytic
set key off

# plot
set parametric
a=5
b=4
delta=pi/2
plot [0:2*pi] sin(a*t + delta),sin(b*t) with lines linewidth 2
and then I post-processed with Inkscape
Författare/Upphovsman: TedPavlic, Licens: CC BY-SA 3.0
Figure showing several Lissajous figures for different phase delays.
A Lissajous curve that can be expressed in parametric form as:
with , and . I created it with the following GNUplot code:
set samples 5000
set terminal svg
set output "Lissajous_curve_1by2.svg"

# plotting within a square
set size square

# remove most of information from the picture
unset xtic
unset ytic
set key off

# plot
set parametric
a=7
b=6
delta=pi/2
plot [0:pi/2] sin(a*t + delta),sin(b*t) with lines linewidth 2
and then I post-processed with Inkscape: I converted the graph to beziers (aka Simplify), cloned and rotated the curve (π/2) to get the entire graph (2π), and resized the final image to 600x600 with a 18.854px margin, like the others. I also manually edited and removed any unnecessary elements. All of this resulted in a smoother graph with a small file size.
Författare/Upphovsman: Alessio Damato, Licens: CC BY-SA 3.0
A Lissajous curve, that can be expressed in parametric form as:
with , and . I created it with the following GNUplot code:
set samples 5000
set terminal svg
set output "Lissajous_curve_5by6.svg"

# plotting within a square
set size square

# remove most of information from the picture
set noxtic
set noytic
set key off

# plot
set parametric
a=5
b=6
delta=pi/2
plot [0:2*pi] sin(a*t + delta),sin(b*t) with lines linewidth 2
and then I post-processed with Inkscape


