Europeiska unionens demografi
| Europeiska unionens demografi | |
 Karta som visar befolkningstätheten 2017, inklusive länder utanför EU | |
| Folkmängd | 447 706 209 (2020)[1] |
|---|---|


Europeiska unionens demografi visar en tätbefolkad union bestående av 27 medlemsstater. Den 1 januari 2018 var befolkningen i EU omkring 512,6 miljoner invånare.[2]
Befolkning efter medlemsstat
Den medlemsstat med högst befolkning är Tyskland, med ett beräknat invånarantal på omkring 82,1 miljoner människor. Den minst befolkade medlemsstaten i EU är Malta, med omkring 400 000 invånare. Fertiliteten inom EU är låg, med ett snitt på ungefär 1,6 barn per kvinna. De länder med högst fertilitet är Irland med 16,876 födslar per 1 000 invånare per år och Frankrike med 13,013 födslar per 1 000 invånare per år. Tyskland har lägst fertilitet i EU med 8,221 födslar per 1 000 invånare per år.
| Medlemsstat | Befolkning | Procent av EU:s totala befolkning | Landarea km2 | Procent av EU:s totala landarea | Befolkningstäthet Invånare/km2 |
|---|---|---|---|---|---|
| 448 387 872 | 100,00% | 4 079 962 | 100,00 | 109,56 | |
| 9 104 772 | 2,03% | 83 858 | 1,98 | 106,52 | |
| 11 754 004 | 2,62% | 30 510 | 0,72 | 378,76 | |
| 6 447 710 | 1,44% | 110 912 | 2,62 | 62,36 | |
| 3 850 894 | 0,86% | 56 594 | 1,34 | 71,32 | |
| 920 701 | 0,21% | 9 250 | 0,22 | 92,41 | |
| 10 827 529 | 2,41% | 78 866 | 1,86 | 135,69 | |
| 5 932 654 | 1,32% | 43 094 | 1,02 | 135,51 | |
| 1 365 884 | 0,3% | 45 226 | 1,07 | 29,4 | |
| 5 563 970 | 1,24% | 337 030 | 7,96 | 16,41 | |
| 68 070 697 | 15,18% | 643 548 | 15,2 | 104,79 | |
| 84 358 845 | 18,81% | 357 021 | 8,43 | 232,63 | |
| 10 394 055 | 2,32% | 131 957 | 3,12 | 80,95 | |
| 9 597 085 | 2,14% | 93 030 | 2,2 | 104,59 | |
| 5 194 336 | 1,16% | 70 280 | 1,66 | 71,24 | |
| 58 850 717 | 13,12% | 301 320 | 7,12 | 196,65 | |
| 1 883 008 | 0,42% | 64 589 | 1,53 | 29,31 | |
| 2 857 279 | 0,64% | 65 200 | 1,54 | 42,87 | |
| 660 809 | 0,15% | 2 586 | 0,06 | 245,44 | |
| 542 051 | 0,12% | 316 | 0,01 | 1 633,22 | |
| 17 811 291 | 3,97% | 41 526 | 0,98 | 420,83 | |
| 36 753 736 | 8,20% | 312 685 | 7,38 | 121,01 | |
| 10 467 366 | 2,33% | 92 931 | 2,19 | 110,81 | |
| 19 051 562 | 4,25% | 238 391 | 5,63 | 80,48 | |
| 5 428 792 | 1,21% | 48 845 | 1,15 | 111,77 | |
| 2 116 792 | 0,47% | 20 253 | 0,48 | 104,13 | |
| 48 059 777 | 10,72% | 504 782 | 11,92 | 93,89 | |
| 10 521 556 | 2,35% | 449 964 | 10,63 | 23,06 |
Områden med störst befolkning
Europeiska unionen har ett stort antal världsstäder. EU innefattade 13 av de 60 städer som utgjorde 2008 års Global Cities Index,[4] såväl som 16 av de 41 världsstäder som av GaWC klassificerats som "alfa" (inkluderande bland annat Paris, Milano, Amsterdam och Bryssel). Det följande är en lista över EU:s tio mest befolkade städer, tätorter och storstadsområden:
Befolkningsutveckling
(2018)[5] | (‰) (2017)[6] | (‰) (2017)[6] | (‰) (2017)[6] | (2016)[6] | |
|---|---|---|---|---|---|
| 512 647 966 | 2,2 | -0,4 | 2,6 | 1,60 | |
| 82 850 000 | 4,0 | -1,8 | 5,8 | 1,60 | |
| 67 221 943 | 3,5 | 2,5 | 1,0 | 1,92 | |
| 60 483 973 | -1,7 | -3,2 | 1,4 | 1,34 | |
| 46 659 302 | 2,8 | -0,7 | 3,5 | 1,34 | |
| 37 976 687 | 0,1 | 0,0 | 0,1 | 1,39 | |
| 19 523 621 | -6,2 | -3,6 | -2,5 | 1,64 | |
| 17 118 084 | 2,1 | 1,1 | 1,0 | 1,66 | |
| 11 413 058 | 5,4 | 0,9 | 4,5 | 1,68 | |
| 10 738 868 | -2,7 | -3,3 | 0,6 | 1,38 | |
| 10 610 055 | 2,9 | 0,3 | 2,7 | 1,63 | |
| 10 291 027 | -1,8 | -2,3 | 0,5 | 1,36 | |
| 10 120 242 | 12,4 | 2,3 | 10,1 | 1,85 | |
| 9 778 371 | -2,0 | -3,8 | 1,8 | 1,53 | |
| 8 822 267 | 5,6 | 0,5 | 5,1 | 1,53 | |
| 7 050 034 | -7,3 | -6,5 | -0,8 | 1,54 | |
| 5 781 190 | 5,6 | 1,4 | 4,2 | 1,79 | |
| 5 513 130 | 1,8 | -0,6 | 2,4 | 1,57 | |
| 5 443 120 | 1,4 | 0,7 | 0,7 | 1,48 | |
| 4 838 259 | 11,2 | 6,6 | 4,6 | 1,81 | |
| 4 105 493 | -11,8 | -4,1 | -7,7 | 1,42 | |
| 2 808 901 | -13,8 | -4,0 | -9,7 | 1,69 | |
| 2 066 880 | 0,5 | -0,1 | 0,6 | 1,58 | |
| 1 934 379 | -8,1 | -4,1 | -4,0 | 1,74 | |
| 1 319 133 | 2,7 | -1,3 | 4,0 | 1,60 | |
| 864 236 | 11,0 | 3,8 | 7,2 | 1,37 | |
| 602 005 | 19,0 | 3,2 | 15,8 | 1,41 | |
| 475 701 | 32,9 | 1,6 | 31,3 | 1,37 | |
Se även
Referenser
- Den här artikeln är helt eller delvis baserad på material från engelskspråkiga Wikipedia, Demographics of the European Union, 13 januari 2019.
Noter
- ^ läs online, ec.europa.eu .[källa från Wikidata]
- ^ ”Eurostat - Population on 1 January 2018”. Eurostat - Population on 1 January 2018. http://ec.europa.eu/eurostat/tgm/table.do?tab=table&init=1&language=en&pcode=tps00001&plugin=1. Läst 13 juli 2018.
- ^ ”EUROSTAT Population on 1 January”. Epp.eurostat.ec.europa.eu. https://ec.europa.eu/eurostat/databrowser/view/tps00001/default/table?lang=en.
- ^ ”The 2008 Global Cities Index”. Arkiverad från originalet den 20 april 2010. https://web.archive.org/web/20100420024728/http://www.atkearney.com/index.php/Publications/global-cities-index.html. Läst 27 april 2010.
- ^ ”Eurostat - Tables, Graphs and Maps Interface (TGM) table”. Epp.eurostat.ec.europa.eu. 11 augusti 2016. http://epp.eurostat.ec.europa.eu/tgm/table.do?tab=table&language=en&pcode=tps00001&tableSelection=1&footnotes=yes&labeling=labels&plugin=1. Läst 30 mars 2017.
- ^ [a b c d] ”Eurostat - Tables, Graphs and Maps Interface (TGM) table”. Epp.eurostat.ec.europa.eu. 11 augusti 2016. http://ec.europa.eu/eurostat/tgm/table.do?tab=table&init=1&language=en&pcode=tps00019&plugin=1. Läst 7 juli 2018.
Vidare läsning
- Davies, Ron (2013) (på engelska). Promoting fertility in the EU: Social policy options for Member States. Library of the European Parliament. sid. 10. http://www.europarl.europa.eu/RegData/bibliotheque/briefing/2013/130519/LDM_BRI(2013)130519_REV2_EN.pdf
- Claros, Eulalia. ”Migration in the EU” (på engelska). Library statistical spotlight. Library of the European Parliament. http://www.europarl.europa.eu/RegData/bibliotheque/stspotlight/2013/130572/LDM_STS(2013)130572_REV1_EN.pdf. Läst 14 juni 2013.
Externa länkar
Media som används på denna webbplats
The Flag of Europe is the flag and emblem of the European Union (EU) and Council of Europe (CoE). It consists of a circle of 12 golden (yellow) stars on a blue background. It was created in 1955 by the CoE and adopted by the EU, then the European Communities, in the 1980s.
The CoE and EU are distinct in membership and nature. The CoE is a 47-member international organisation dealing with human rights and rule of law, while the EU is a quasi-federal union of 27 states focused on economic integration and political cooperation. Today, the flag is mostly associated with the latter.
It was the intention of the CoE that the flag should come to represent Europe as a whole, and since its adoption the membership of the CoE covers nearly the entire continent. This is why the EU adopted the same flag. The flag has been used to represent Europe in sporting events and as a pro-democracy banner outside the Union.The civil ensign and flag of Belgium. It is identical to Image:Flag of Belgium.svg except that it has a 2:3 ratio, instead of 13:15.
Det är enkelt att lägga till en ram runt den här bilden
Flag of Portugal, created by Columbano Bordalo Pinheiro (1857–1929), officially adopted by Portuguese government in June 30th 1911 (in use since about November 1910). Color shades matching the RGB values officially reccomended here. (PMS values should be used for direct ink or textile; CMYK for 4-color offset printing on paper; this is an image for screen display, RGB should be used.)
The flag of Slovenia.
- "The construction sheet for the coat of arms and flag of the Republic of Slovenia
- is issued in the Official Gazette Uradni list Republike Slovenije #67, 27 October 1994
- as the addendum to the Law on the coat of arms and flag."
A cartogram depicting population distribution within the European Union at the member state level. Note how roughly half of all citizens within the EU live within the 4 largest member states: Germany, France, United Kingdom, and Italy.
Författare/Upphovsman: Den här vektoriserade bilden innehåller hämtade eller omarbetade delar av den här filen:, Licens: CC BY-SA 4.0
Density of Population in the European Union in a NUTS-2 map with national data from 2014.
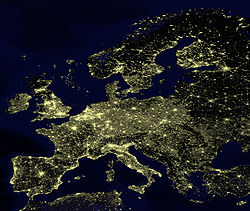
Light pollution in Europe, 2002.
A preliminary population cartogram of the EU-27 made with ScapeToad 1.1 using a cut-down and reprojected public domain world shapefile (projection: Lambert Azimuthal Equal Area) and January 2008 population data from Eurostat. This version includes Dutch barrier islands.
Författare/Upphovsman: dieghernan, Licens: CC BY-SA 4.0
Density of Population in the European Union in a NUTS-3 map with national data from 2017.
