Atlantiska orkansäsongen 2008
| Första system: | Tropiska stormen Arthur (31 maj) | ||||||
| Aktiva system: | Tropiska stormen Nana, Tropiska depressionen Femton | ||||||
| Antal namngivna stormar: | 14 | ||||||
| Antal orkaner: | 6 | ||||||
| Antal större orkaner (Kat 3+): | 3 | ||||||
| Starkaste stormen: | Ike - 935 mbar (hPa) (27.79 inHg), 230 km/h | ||||||
| Antal system som gått in över land: | 8 | ||||||
| Total kostnad: | $21,6 miljarder (~142 miljarder kr) | ||||||
| Totalt ACE: | 123.1 | ||||||
| Bekräftade dödsfall: | 822 direkt, 42 indirekt | ||||||
| Totalt | |||||||
|---|---|---|---|---|---|---|---|
| 1 | 8 | 2 | 1 | 1 | 2 | 0 | 15 |
| Atlantiska orkansäsonger 2006 2007 2008 2009 2010 | |||||||
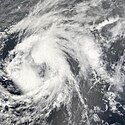
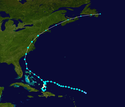
Den atlantiska orkansäsongen 2008 pågick officiellt från den 1 juni 2008 till den 30 november 2008. Historiskt sett bildas de allra flesta tropiska cyklonerna under denna period på året. Orkansäsongen startade något tidigt med den tropiska stormen Arthur som bildades den 31 maj strax utanför Belizes kust.
Orkannamn 2008
Varje år görs en lista upp över vilka orkannamn som skall gälla för det året. Om möjligt återanvänds listan vart sjätte år; listan för 2008 är således samma som listan för 2002 förutom att Ike och Laura kommer att ersätta Isidore och Lili.
- Arthur (storm)
- Bertha (orkan)
- Cristobal (storm)
- Dolly (orkan)
- Edouard (storm)
- Fay (storm)
- Gustav (orkan)
- Hanna (orkan)
- Ike (orkan)
- Josephine (storm)
- Kyle (orkan)
- Laura (storm)
- Marco (storm)
- Nana (storm)
- Omar
- Paloma
- Rene
- Sally
- Teddy
- Vicky
- Wilfred
Stormar
Tropiska stormen Arthur
| ||||
|---|---|---|---|---|
| ||||
| Period | 31 maj 2008–2 juni 2008 | |||
| Intensitet | 65 km/h (20 m/s) 1005 mbar (29.69 inHg) | |||
Den tropiska stormen Arthur bildades alldeles utanför Belizes kust den 31 maj, från det lågtryck som var associerat med den tropiska stormen Alma. Arthur är den första tropiska storm att bildas i maj sedan 1981. System har tidigare år bildats så här tidigt under säsongen (såsom den subtropiska stormen Andrea 2007), men dessa har stannat i det subtropiska stadiet.
Orkanen Bertha
| ||||
|---|---|---|---|---|
| ||||
| Period | 3 juli–20 juli | |||
| Intensitet | 195 km/h (55 m/s) 948 mbar (28.01 inHg) | |||
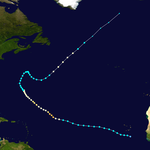
Den 3 juli bildades en tropisk depression ur en tropisk våg söder om Kap Verde-öarna. Den tilltog i styrka och blev en tropisk storm senare under dagen. Den 6 juli ökade Bertha i styrka och blev kategoriserad som orkan den 7 juli. Under den dagen ökade Bertha kraftigt i intensitet och blev säsongens första större orkanen (kategori 3 eller större) med vindar upp till 195 km/h och ett väldefinierat öga. Den försvagades dock lika snabbt och återgick till kategori 1-styrka den 8 juli.
Tropiska stormen Cristobal
| ||||
|---|---|---|---|---|
| ||||
| Period | 18 juli–23 juli | |||
| Intensitet | 100 km/h (30 m/s) 1000 mbar (29.54 inHg) | |||
Den 18 juli bildades den tropiska depression Tre ur ett lågtryck utanför delstaten Georgias kust. Den blev senare under dagen klassificerad som en tropisk storm. Den rörde sig parallellt med USA:s östkust, men gick aldrig in över land. Cristobal blev extratropisk den 23 juli.
Orkanen Dolly
| ||||
|---|---|---|---|---|
| ||||
| Period | 20 juli–25 juli | |||
| Intensitet | 155 km/h (45 m/s) 964 mbar (28.48 inHg) | |||
Den tropiska stormen Dolly bildades ur en kraftig tropisk våg som hade passerat genom Karibiska havet under veckan. Den gick in över land tidigt den 21 juli vid Cancún, Mexiko och kom till Mexikanska golfen senare under dagen. Jordskred orsakade av kraftigt regn orsakade 17 dödsfall i Guatemala.
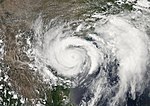
Den 22 juli blev Dolly säsongens andra orkan. Den ökade stadigt i styrka och nådde kategori 2-styrka tidigt den 23 juli. Senare under dagen gick den över land vid South Padre Island i Texas med vindhastigheter på 155 km/h och ett lufttryck på 964 mbar. Ytterligare 4 personer dog när den gick in över land för andra gången, vilket gjorde att sammanlagt 21 personer dog av Dolly.
Trots att Dolly inte orsakade några dödsfall i Texas blev det den orkan som orsakat mest skada sedan Orkanen Rita 2005, med 1,2 miljarder dollar (ungefär 7,2 miljarder kr) i skada, och den tredje mest kostsamma i Texas historia, efter Orkanen Alicia 1983 och Rita. Stormen avmattades över norra Mexiko den 25 juli.
Tropiska stormen Edouard
| ||||
|---|---|---|---|---|
| ||||
| Period | 3 augusti–7 augusti | |||
| Intensitet | 100 km/h (30 m/s) 997 mbar (29.45 inHg) | |||
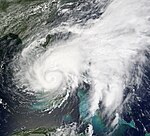
Ett ovädersområde bildades i den nordöstra delen av Mexikanska golfen tidigt i augusti. Gynnsamma förhållanden gjorde så att systemet kunde utvecklas vidare och närmade sig allt mer en tropisk depression. Den tropiska depression Fem bildades den 3 augusti men ökade i styrka samma dag och blev namngiven den tropiska stormen Edouard. Edouard avmattades efter att den gått in över land vid gränsen mellan Texas och Louisiana den 5 augusti.
Tropiska stormen Fay
| ||||
|---|---|---|---|---|
| ||||
| Period | 15 augusti–26 augusti | |||
| Intensitet | 100 km/h (30 m/s) 986 mbar (29.13 inHg) | |||
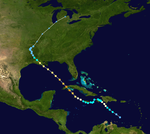
En kraftig tropisk våg färdades in i den nordöstra delen av Västindien i mitten av augusti. Den producerade kraftigt regn längs Leeward Islands och in Puerto Rico innan den färdades västerut. Den 15 augusti blev området så organiserat så att systemet blev den tropiska stormen Fay. Fay drog in över land sju gånger, varav fyra i delstaten Florida. Fay avmattades den 26 augusti.
36 dödsoffer skylls på Fay.
Orkanen Gustav
| ||||
|---|---|---|---|---|
| ||||
| Period | 25 augusti–4 september | |||
| Intensitet | 240 km/h (65 m/s) 941 mbar (27.8 inHg) | |||
Under den fjärde veckan i augusti drog ett oväderssystem in i Karibiska havet, där det mötte gynnsamma förhållanden för utveckling. Systemet blev en tropisk depression den 25 augusti, väster om Windward Islands. Gustav nådde kategori 4-styrka strax innan den drog in över Kuba den 30 augusti. Gustav försvagades något i Mexikanska golfen och drog in över land i Louisiana den 1 september, då som en kategori 3-orkan och avmattades strax efter.
120 dödsfall skylls på Gustav. Kostnaden för Gustavs skador uppskattas till 20 miljarder dollar.
Orkanen Hanna
| ||||
|---|---|---|---|---|
| ||||
| Period | 28 augusti–7 september | |||
| Intensitet | 130 km/h (35 m/s) 978 mbar (28.89 inHg) | |||
Den tropiska depressionen Åtta bildades den 28 augusti ur ett lågtrycksområde ost-nordost om norra Leeward Islands. Depressionen blev uppgraderad till den tropiska stormen Hanna senare samma dag. Hanna tilltog i styrka och nådde orkanstyrka den 1 september. Den färdades runt sydöstra Bahamas och försvagades till en tropisk storm. Minst 536 dödsfall har skyllts på Hanna, främst på Haiti. Hanna blev en extratropisk cyklon då den drog ut från land vid Massachusetts tidigt den 7 september.
Orkanen Ike
| ||||
|---|---|---|---|---|
| ||||
| Period | 1 september–14 september | |||
| Intensitet | 230 km/h (65 m/s) 935 mbar (27.62 inHg) | |||
En tropisk våg bildades utanför Afrikas västkust i slutet av augusti. Den passerade söder om Kap Verde-öarna och började att sakta utvecklas och blev den tropiska depressionen Nio väster om Kap Verde-öarna den 1 september. Depressionen utvecklades till en tropisk storm senare under dagen. Den 3 september tilltog Ike kraftigt i styrka från en tropisk storm till en kategori 4-orkan på endast 12 timmar.
Tropiska stormen Josephine
| ||||
|---|---|---|---|---|
| ||||
| Period | 2 september–6 september | |||
| Intensitet | 100 km/h (30 m/s) 994 mbar (29.36 inHg) | |||
En tropisk våg bildades utanför Afrikas västkust i slutet av augusti. Den passerade söder om Kap Verde-öarna och började att sakta utvecklas och blev den tropiska depressionen Nio sydost om Kap Verde-öarna den 2 september. Depressionen utvecklades till en tropisk storm senare under dagen. Josephine försvagades över de nästkommande dagarna och avmattades den 6 september, utan att ha hotat land.
Orkanen Kyle
| ||||
|---|---|---|---|---|
| ||||
| Period | 25 september–29 september | |||
| Intensitet | 130 km/h (35 m/s) 984 mbar (29.07 inHg) | |||
Ett kraftigt tropiskt område färdades i den nordöstra delen av Karibiska havet under den tredje veckan i september. Den passerade över Puerto Rico och Hispaniola och orsakade kraftiga regn, men organiserades aldrig tillräckligt för att bli ett tropiskt system. Den 24 september började området att färdas norrut, bort frår öarna och ut i öppna Atlanten och blev en tropisk storm den 25 september. Kyle uppgraderades till en orkan på eftermiddagen den 27 september och höll den styrkan tills den drog in över land nära Yarmouth, Nova Scotia sent den 28 september. Några timmar senare blev Kyle extratropisk.
Subtropiska stormen Laura
| ||||
|---|---|---|---|---|
| ||||
| Period | 29 september–1 oktober | |||
| Intensitet | 95 km/h (25 m/s) 993 mbar (29.34 inHg) | |||
En icke-tropisk cyklon fick subtropiska egenskaper och fick namnet den subtropiska stormen Laura tidigt den 29 september.
Tropiska stormen Marco
| ||||
|---|---|---|---|---|
| ||||
| Period | 6 oktober–8 oktober | |||
| Intensitet | 100 km/h (30 m/s) 998 mbar (29.48 inHg) | |||
Den tropiska depressionen Tretton bildades ur ett väldigt litet, men välorganiserat lågtryck i Campechebukten den 6 oktober. Den tilltog snabbt i styrka till vindar uppemot 100 km/h senare under eftermiddagen. Marco drog in över land nära Veracruz i Mexiko nästa morgon med samma intensitet. Marco avmattades under natten då systemet drog in över land. Vid en tidpunkt nådde vindar med tropisk stormstyrka endast 15 km från dess centrum, vilket gör den till den minsta tropiska stormen någonsin efter Cyklonen Tracy.
Tropiska stormen Nana
| ||||
|---|---|---|---|---|
| ||||
| Period | 12 oktober– | |||
| Intensitet | 65 km/h (20 m/s) 1005 mbar (29.69 inHg) | |||
Den tropiska stormen Nana bildades den 12 oktober ur ett ovädersområde som hade färdats nordväst de föregående dagarna i mitten av Atlanten, ungefär halvvägs mellan Afrikas västkust och de Små Antillerna.
Tropiskt lågtryck nr 15
| ||||
|---|---|---|---|---|
| ||||
| Period | 13 oktober– | |||
| Intensitet | 55 km/h (15 m/s) 1005 mbar (29.69 inHg) | |||
Ett område oväder i Karibiska havet organiserades sakta under den andra veckan i oktober. Medan den färdades sakta genom området blev den tillräckligt organiserad för att bli en tropisk depression den 13 oktober.
Externa länkar
Media som används på denna webbplats
Track map of Tropical Storm Arthur of the 2008 Atlantic hurricane season. The points show the location of the storm at 6-hour intervals. The colour represents the storm's maximum sustained wind speeds as classified in the (see below), and the shape of the data points represent the nature of the storm, according to the legend below.
Storm type
Tropical Storm Edouard off Louisana.
Track map of Tropical Storm Edouard of the 2008 Atlantic hurricane season. The points show the location of the storm at 6-hour intervals. The colour represents the storm's maximum sustained wind speeds as classified in the (see below), and the shape of the data points represent the nature of the storm, according to the legend below.
Storm type
Tropical Storm Josephine on September 3, 2008 at 12:20 UTC, taken by the Terra satellite.
Symbol for a tropical storm in the Northern Hemisphere.
Hurricane Gustav at Cuban landfall with winds of 150 miles per hour on August 30, 2008.
Track map of Tropical Storm Fay of the 2008 Atlantic hurricane season. The points show the location of the storm at 6-hour intervals. The colour represents the storm's maximum sustained wind speeds as classified in the (see below), and the shape of the data points represent the nature of the storm, according to the legend below.
Storm type
Track map of Hurricane Bertha of the 2008 Atlantic hurricane season. The points show the location of the storm at 6-hour intervals. The colour represents the storm's maximum sustained wind speeds as classified in the (see below), and the shape of the data points represent the nature of the storm, according to the legend below.
Storm type
Track map of Hurricane Omar of the 2008 Atlantic hurricane season. The points show the location of the storm at 6-hour intervals. The colour represents the storm's maximum sustained wind speeds as classified in the (see below), and the shape of the data points represent the nature of the storm, according to the legend below.
Storm type
Track map of Hurricane Ike of the 2008 Atlantic hurricane season. The points show the location of the storm at 6-hour intervals. The colour represents the storm's maximum sustained wind speeds as classified in the (see below), and the shape of the data points represent the nature of the storm, according to the legend below.
Storm type
Track map of Tropical Storm Cristobal of the 2008 Atlantic hurricane season. The points show the location of the storm at 6-hour intervals. The colour represents the storm's maximum sustained wind speeds as classified in the (see below), and the shape of the data points represent the nature of the storm, according to the legend below.
Storm type
Track map of Tropical Storm Laura of the 2008 Atlantic hurricane season. The points show the location of the storm at 6-hour intervals. The colour represents the storm's maximum sustained wind speeds as classified in the (see below), and the shape of the data points represent the nature of the storm, according to the legend below.
Storm type
Track map of Tropical Storm Josephine of the 2008 Atlantic hurricane season. The points show the location of the storm at 6-hour intervals. The colour represents the storm's maximum sustained wind speeds as classified in the (see below), and the shape of the data points represent the nature of the storm, according to the legend below.
Storm type
Track map of Hurricane Kyle of the 2008 Atlantic hurricane season. The points show the location of the storm at 6-hour intervals. The colour represents the storm's maximum sustained wind speeds as classified in the (see below), and the shape of the data points represent the nature of the storm, according to the legend below.
Storm type
Track map of Hurricane Gustav of the 2008 Atlantic hurricane season. The points show the location of the storm at 6-hour intervals. The colour represents the storm's maximum sustained wind speeds as classified in the (see below), and the shape of the data points represent the nature of the storm, according to the legend below.
Storm type
Hurricane Dolly intensified to a Category 2 storm in the Gulf of Mexico on July 23, 2008, just before it bore down on South Padre Island off the South Texas coast. At its strongest, the storm’s winds reached sustained speeds of 100 miles per hour, with higher gusts. As of the 2:00 p.m. (Central Daylight Time) advisory from the National Hurricane Center, Dolly had weakened to a Category 1 storm because part of the circulation was over land; winds were about 95 miles per hour.
Icône représentant une dépression tropicale, selon le code de couleurs de la section Cyclone. Icon for an tropical depression, using the colors from the Cyclone section.
Créé par / created by User:The Shadow KnowsTD 15 of 2008.
Track map of Hurricane Dolly of the 2008 Atlantic hurricane season. The points show the location of the storm at 6-hour intervals. The colour represents the storm's maximum sustained wind speeds as classified in the (see below), and the shape of the data points represent the nature of the storm, according to the legend below.
Storm type
Subtropical Storm Laura on September 29
Place-holder image for use in Northern Hemisphere tropical cyclone articles, without an image or track map.
Track map of Tropical Storm Nana of the 2008 Atlantic hurricane season. The points show the location of the storm at 6-hour intervals. The colour represents the storm's maximum sustained wind speeds as classified in the (see below), and the shape of the data points represent the nature of the storm, according to the legend below.
Storm type
Track map of Hurricane Hanna of the 2008 Atlantic hurricane season. The points show the location of the storm at 6-hour intervals. The colour represents the storm's maximum sustained wind speeds as classified in the (see below), and the shape of the data points represent the nature of the storm, according to the legend below.
Storm type
Track map of Tropical Storm Marco of the 2008 Atlantic hurricane season. The points show the location of the storm at 6-hour intervals. The colour represents the storm's maximum sustained wind speeds as classified in the (see below), and the shape of the data points represent the nature of the storm, according to the legend below.
Storm type
MODIS image of Hurricane Bertha. 1630Z


