Atlantiska orkansäsongen 2006
| Första system: | Alberto (10 juni) | ||||||
| Sista system: | Isaac (10 oktober) | ||||||
| Aktiva system: | 10 | ||||||
| Antal namngivna stormar: | 10 | ||||||
| Antal orkaner: | 5 | ||||||
| Antal större orkaner (Kat 3+): | 2 | ||||||
| Starkaste stormen: | Helene och Gordon | ||||||
| Antal system som gått in över land: | 2 | ||||||
| Total kostnad: | $500 miljoner | ||||||
| Totalt ACE: | 78.5 | ||||||
| Bekräftade dödsfall: | 11 direkt, 6 indirekt | ||||||
| Totalt | |||||||
|---|---|---|---|---|---|---|---|
| 0 | 5 | 3 | 0 | 2 | 0 | 0 | 10 |
| Atlantiska orkansäsonger 2004 2005 2006 2007 2008 | |||||||
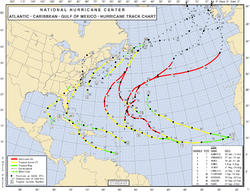
Den atlantiska orkansäsongen 2006 pågick från den 1 juni 2006 till den 30 november 2006. Historiskt sett så bildas de allra flesta tropiska cyklonerna under denna period på året.
Orkannamn 2006
Varje år görs en lista upp över vilka orkannamn som skall gälla för det året. Om möjligt återanvänds listan vart sjätte år, listan för 2006 är således samma som listan för 2000 förutom att Kirk ersätter Keith.
- Alberto (storm)
- Ej namngiven (storm)
- Beryl (storm)
- Chris (storm)
- Debby (storm)
- Ernesto (orkan)
- Florence (orkan)
- Gordon (orkan)
- Helene (orkan)
- Isaac (orkan)
- Joyce
- Kirk
- Leslie
- Michael
- Nadine
- Oscar
- Patty
- Rafael
- Sandy
- Tony
- Valerie
- William
Stormar
Tropiska stormen Alberto
| ||||
|---|---|---|---|---|
| ||||
| Period | 10 juni–10 juni | |||
| Intensitet | 110 km/h (30 m/s) 995 mbar (29.39 inHg) | |||
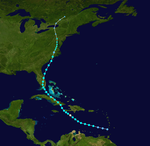
Den tropiska stormen Alberto bildades den 11 juni 2006. Stormen utvecklades ur ett område med oroligt väder som hängde ihop med ett stort lågtrycksområde utanför Belize kust. Stormområdet rörde sig över Mexikanska golfen och nådde sin högsta vindhastighet på 32 m/s (115 km/h) strax innan den nådde land. Stormområdet passerade över norra Florida under den 13 juni 2006 och fortsatte försvagat över Georgia och vidare ut över Atlanten. Väderområdet hade då försvagats så att det inte längre var en tropisk cyklon utan ett lågtryckscentrum. Resterna av ovädret nådde den 20 juni Brittiska öarna. Det fortfarande djupa lågtrycket på cirka 985 hPa hade då sitt centrum norr om Skottland. Det tillhörande regnområdet drog den 21 juni in över Sverige och den 22 juni över Finland.
Ej namngiven tropisk storm
| ||||
|---|---|---|---|---|
| ||||
| Period | 17 juni–18 juni | |||
| Intensitet | 85 km/h (25 m/s) 998 mbar (29.48 inHg) | |||
Tropiska stormen Beryl
| ||||
|---|---|---|---|---|
| ||||
| Period | 18 juli–21 juli | |||
| Intensitet | 95 km/h (25 m/s) 1000 mbar (29.54 inHg) | |||
Ett oväder utanför USA:s östkust bildar den 18 juli den tropisk stormen Beryl. Stormen rörde sig norrut och stärktes av Golfströmmens varma vatten. Den 21 juli stryker Beryl förbi ön Nantucket i Massachusetts, stormen hade då en vindhastighet på 23 m/s (85 km/h). Väderområdet försvagades på sin väg nordöstöver och övergick från att vara en tropisk cyklon till att vara ett lågtryckscentrum över östra Kanada. Resterna av ovädret drog över Atlanten mot Nordeuropa, lågtryck var fortfarande mycket lågt, den 27 juli var det 975 hPa. Det tillhörande frontområdet drog den 29 juli in över Storbritannien och den 31 juli över södra Skandinavien.
Tropiska stormen Chris
| ||||
|---|---|---|---|---|
| ||||
| Period | 31 juli–5 augusti | |||
| Intensitet | 100 km/h (30 m/s) 1001 mbar (29.57 inHg) | |||
Öster om Antigua bildades den 1 augusti den tropiska stormen Chris. Stormen utvecklades ur ett område med orolig atmosfär, en så kallad tropisk våg i atmosfären, som dragit västerut från Afrikas kust. Stormen drog västerut, strax norr om de karibiska öarna men tappade kraft innan den nådde Bahamas. Den 4 augusti klassades ovädret inte längre som en tropisk storm och när det drog in över Kuba var det inte en tropisk cyklon längre.
Tropiska stormen Debby
| ||||
|---|---|---|---|---|
| ||||
| Period | 21 augusti–26 augusti | |||
| Intensitet | 85 km/h (25 m/s) 999 mbar (29.51 inHg) | |||
En tropisk cyklon bildades utanför Afrikas västkust och rörde sig upp mot Kap Verde-öarna. Den 22 augusti utvecklas ovädret till den tropiska stormen Debby men försvagas igen så att den 26 augusti klassades den inte längre som en tropisk storm.
Orkanen Ernesto
| ||||
|---|---|---|---|---|
| ||||
| Period | 24 augusti–1 september | |||
| Intensitet | 120 km/h (35 m/s) 985 mbar (29.1 inHg) | |||
Orkan Ernesto som var den första för 2006 års orkansäsong bildades den 27 augusti strax söder om Haiti. som mest var vindstyrkorna 120 km/h (33 m/s). Först förutspåddes en hastig förvärring av orkanen men istället avtog den till en tropisk storm redan på eftermiddagen den 27:e. Stormen medförde kraftiga regn över södra Haiti som tog några personers liv. Den 28 augusti nådde stormen Kuba vid Guantanamo Bay med vindhastigheter på cirka 75 km/h (20 m/s). Den 29 augusti lämnade stormen Kuba och drog med vindhastigheter på cirka 75 km/h vidare mot södra Florida. Den 30 augusti drog ovädret över södra Florida och sedan vidare ut i Atlanten där den stärktes, vindhastigheten var då 95 km/h (26 m/s). Den 31 augusti drog stormen in över North Carolina med vindhastigheten 112 km/h (31 m/s) men försvagades över land och förlorade sin status som tropisk storm den 1 september. Resterna i form av ett lågtryckscentrum med tillhörande regnfronter drog vidare norrut i inlandet.
Ovädret fick sitt namn redan den 25 augusti då ovädret klassades som en tropisk storm i Karibiska havet väster om Små Antillerna. Stormen hade utvecklats ur ett lågtryck av tropisk cyklon-typ som bildats öster om Antillerna.
Orkanen Florence
| ||||
|---|---|---|---|---|
| ||||
| Period | 3 september–12 september | |||
| Intensitet | 145 km/h (40 m/s) 974 mbar (28.77 inHg) | |||
Den tropiska stormen Florence bildades den 5 september 2006. Stormen utvecklades ur ett djupt lågtrycksområde mitt ute på Atlanten, rakt väster om Kap Verde-öarna. Stormen rörde sig initialt västnordväst mot Nordamerika med vindhastigheter på cirka 65 km/h (18 m/s). Den 8 september passerade stormen 800 km norr om Antillerna med vindhastigheter på 85 km/h (23 m/s). Stormen var ovanligt vid med stormstyrka i ett område på 650 km runt stormens centrum.
Den 10 september fördjupas stormen till en orkan med vindhastigheter på 130 km/h (35 m/s) och dess bana vred norrut så att dess centrum den 11 september passerade 90 km väster om Bermuda. Vindhastigheter på ön var som mest 105 km/h (30 m/s).
Orkanen Gordon
| ||||
|---|---|---|---|---|
| ||||
| Period | 11 september–20 september | |||
| Intensitet | 195 km/h (55 m/s) 955 mbar (28.21 inHg) | |||
Den tropiska stormen Gordon bildades den 11 september 2006 i spåret av orkanen Florence. Ovädret förstärktes hastigt, den 12 september nådde den orkanstyrka, den 13 september nådde den kategori 2 på Saffir–Simpson-orkanskalan och sedan kategori 3. Den blev säsongens första orkanen att bli så kraftig som kategori 3, de maximala medelvindstyrkorna uppnåddes den 14 september på cirka 210km/h (59m/s).
Från det att den uppnådde orkanstyrka, då befann den sig cirka 800 km nordost om Antillerna, rörde den sig norrut över öppet hav i 6 dygn innan den vred österut med riktning mot Azorerna. Den 19 september drog Gordon med vindhastigheter på 165 km/h (50 m/s) över ögruppen Azorerna som dock klarade sig utan allvarligare skador.
Stormområdet fortsatte österut och svepte över Galicien i nordöstra Spanien och vidare norrut till Irland den 21 september. Resterna av ovädret förenade sig med ett djupt lågtryck väster om Irland som gav upphov till en kraftfull sydvind över hela västeuropa, i Sverige märktes detta på de ovanligt höga temperaturerna under helgen 23-24 september.
Orkanen Helene
| ||||
|---|---|---|---|---|
| ||||
| Period | 12 september–24 september | |||
| Intensitet | 195 km/h (55 m/s) 955 mbar (28.21 inHg) | |||
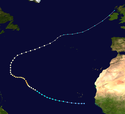
Den tropiska stormen Helene bildades den 13 september 2006 sydväst om Kap Verde-öarna, det fanns då tre namngivna oväder på Atlanten samtidigt: den avtagande orkanen Florence vid Newfoundland, den kraftiga orkanen Gordon ute på Atlanten norr om Antillerna och stormen Helene. Den 16 september förstärktes den till en orkan och nådde kategori 3 på Saffir–Simpson-orkanskalan den 17 september. Den 18 september befann sig orkanen cirka 1400 kilometer nordost om Antillerna och hade en vindstyrka på 205 km/h (57 m/s).
Orkanen vred sig i en vid båge öster om Bermuda, från den ursprungliga nordvästliga banan mot Nordamerika till en nordöstlig bana mot Europa.
Orkanen Isaac
| ||||
|---|---|---|---|---|
| ||||
| Period | 27 september–2 oktober | |||
| Intensitet | 135 km/h (40 m/s) 985 mbar (29.1 inHg) | |||
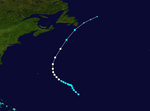
Den tropiska stormen Isaac bildades den 29 september 2006 cirka 900 kilometer sydöst om Bermuda. Den övergick till orkanstyrka den 30 september och passerade 450 kilometer öster om Bermuda innan den drog vidare norrut mot Newfoundland. Orkanen passerade 45 kilometer sydöst om Cape Race.
Se även
Media som används på denna webbplats
Hurricane Ernesto formed in the eastern Caribbean Sea on August 24, 2006. Within a day, it had become organized enough to be classified as a tropical storm and get named as the fifth storm of the 2006 Atlantic Season, Tropical Storm Ernesto. Ernesto built in power gradually as it moves westward and slightly north through the Caribbean Sea, just reaching hurricane strength as it neared Hispaniola (The island on which the nations of Haiti and Dominican Republic are located.) on August 27. This made it the first storm of the 2006 Atlantic season to reach hurricane strength. However, the interactions of the storm with land robbed Ernesto of enough power to sink it back to storm status again, where it is anticipated it will remain until at least after it crosses Cuba, forecast to have happened on August 28. If predictions made on August 28 hold true, the storm will travel most of the length of Cuba, then cross the Straits of Florida, possibly regaining enough power to become a hurricane again before coming ashore again in southern Florida.
This photo-like image was acquired by the Moderate Resolution Imaging Spectroradiometer (MODIS) on the Terra satellite on August 27 2006, at 11:50 a.m. local time (15:50 UTC). Hurricane Ernesto at the time of this image was a well-developed storm system, but its interactions with Hispaniola had started to distort the hurricane enough to rob it of a well-defined eye. According to the University of Hawaii’s Tropical Storm information center, Ernesto had sustained peak winds of around 110 kilometers per hour (65 miles per hour) at the time Aqua MODIS acquired these data.
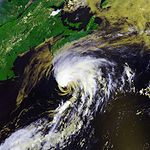
The high-resolution image provided above is provided at the full MODIS spatial resolution (level of detail) of 250 meters per pixel. The MODIS Rapid Response System provides this image at additional resolutions.Tropical Storm Beryl formed in the northwestern Atlantic on July 18, 2006, roughly 200 kilometers (120 miles) southeast of North Carolina’s Outer Banks. The tropical depression gradually gathered just enough power to reach storm status and become the second named storm system of the 2006 Atlantic hurricane season. As of July 20, it had gained only slightly more strength and was headed north towards New York City. Forecasts at the time predicted that the storm would continue to travel north, but then curve away to the east before getting close to land. The storm was also not expected to become strong enough to be classified as a hurricane.
This photo-like image was acquired by the Moderate Resolution Imaging Spectroradiometer (MODIS) on the Terra satellite on July 19, 2006, at 11:15 a.m. local time (15:15 UTC). The storm had a very basic swirling shape embedded within a larger train of clouds stretching northeast. These clouds are associated with a cold front over the Atlantic Ocean. Sustained winds in the storm system were estimated to be around 95 kilometers per hour (60 miles per hour) around the time the image was captured, according to the University of Hawaii’s Tropical Storm Information Center.Symbol for a tropical storm in the Northern Hemisphere.
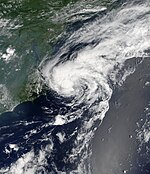
Tropical Storm Alberto formed as a tropical depression early in the morning on June 10, 2006, in the Yucatan Channel. Alberto gradually gathered strength as it took a slow track northward into the Gulf. By early morning on June 11, wind strength within the storm crossed the critical threshold of 39 knots (70 kilometers per hour; 45 miles per hour). Thus Alberto became the first named storm of the 2006 Atlantic hurricane season. Although Alberto briefly flirted with hurricane status as wind speeds came close to the necessary 64 knots (118 km/hr; 74 mph), the system remained a strong tropical storm as of the morning of June 13, and it was projected to weaken as it comes ashore in northern Florida.
This photo-like image was acquired by the Moderate Resolution Imaging Spectroradiometer (MODIS) on the Aqua satellite on June 12, 2006, at 2:35 p.m. local time (18:35 UTC). The tropical storm did have hints of a spiral structure, but as in earlier satellite images, the bulk of the clouds and rainfall from the storm were east of the storm’s center. This large mass of clouds in the image appears over the Florida panhandle and mainland Florida, while the wind circulation center is located roughly 200 kilometers (120 miles) to the west of Tampa.
Sustained winds in the storm system were estimated to be around 110 kilometers per hour (70 miles per hour) around the time the image was captured, according to the University of Hawaii’s Tropical Storm Information Center. However, the less-than-hurricane-strength winds did not mean that Alberto posed no significant hazards. Rainfall totals from the storm were predicted to be between 12 to 25 centimeters (5 to 10 inches), and the storm center was also expected to spawn tornadoes once Alberto crossed land. Drought-stricken Florida was looking for rain, but the heavy downpours predicted were also causing concerns about local flooding.This image of Tropical Storm Chris was captured at 1724 UTC as it passed near the northern Leeward Islands. At the time, winds were 65 mph and the pressure was 1001 mb.
From NASA: Hurricane Gordon was the seventh named storm of the 2006 Atlantic Hurricane Season. Gordon started as a tropical depression off the Leeward Islands in the Caribbean. Since forming on September 10, it had steadily grown in power and size. On September 13, 2006, it became a Category One hurricane, and it intensified further in the next day, reaching Category Three status in the following 24 hours, according to the National Hurricane Center. This made it the first major hurricane in the 2006 Atlantic hurricane season: The previous two hurricanes in 2006, Ernesto and Florence, never intensified beyond Category One strength.
This photo-like image was acquired by the Moderate Resolution Imaging Spectroradiometer (MODIS) on NASA’s Aqua satellite on September 14, 2006, at 1:10 p.m. local time (17:10 UTC). Gordon is a very large and well-defined hurricane in this image, possessing a distinct, tightly wound central portion, a strong and complete eyewall structure all the way around the eye of the storm, and an eye with only a little cloud cover (sometimes called an open, or partially open, eye). These characteristics are all hallmarks of powerful hurricanes. To the north and east of the storm, a large band of more diffuse cloud is pocked with darker spots where powerful thunderstorm systems are forcing up tall cloud towers that cast shadows onto the cloud deck below. Hurricane Gordon had sustained winds of around 185 kilometers per hour (115 miles per hour) at the time this satellite image was acquired, according to The University of Hawaii’s Tropical Storm information center.
Gordon, however, was nowhere near land and as of September 15, it was projected to weaken over cooler waters as it veered northeast in the general direction of the Azores.Hurricane Isaac became the fifth hurricane of the 2006 Atlantic Hurricane season on September 30. Beginning as a tropical depression three days earlier, Isaac formed in the central Atlantic Ocean far from any land. Isaac initially headed northeast on a track towards Bermuda, picking up power to become a hurricane. But Hurricane Isaac never posed a threat to the island, as it was veering off onto a more northerly track even as the storm became more organized and powerful. As of October 2, 2006, Isaac was heading north and slightly east in the general direction of the Canadian Maritime Provinces, but it was expected to curve off east and not come ashore in Canada either. The hurricane was losing power as it travelled north and was downgraded to a tropical storm by midday on October 2.
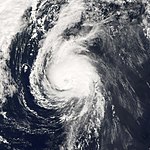
This photo-like image was acquired by the Moderate Resolution Imaging Spectroradiometer (MODIS) on NASA’s Terra satellite on October 1 2006, at 12:35 p.m. local time (14:35 UTC). Isaac is a small well-formed tight ball of spiralling clouds around a well-defined eye filled with clouds (a “closed” eye). According to the University of Hawaii’s Tropical Storm Information Center, Isaac had sustained winds reaching as high as 75 miles per hour (85 mph according to NHC).Track map of Tropical Storm Beryl of the 2006 Atlantic hurricane season. The points show the location of the storm at 6-hour intervals. The colour represents the storm's maximum sustained wind speeds as classified in the (see below), and the shape of the data points represent the nature of the storm, according to the legend below.
Storm type
Track map of Hurricane Ernesto of the 2006 Atlantic hurricane season. The points show the location of the storm at 6-hour intervals. The colour represents the storm's maximum sustained wind speeds as classified in the (see below), and the shape of the data points represent the nature of the storm, according to the legend below.
Storm type
Track map of Hurricane Gordon of the 2006 Atlantic hurricane season. The points show the location of the storm at 6-hour intervals. The colour represents the storm's maximum sustained wind speeds as classified in the (see below), and the shape of the data points represent the nature of the storm, according to the legend below.
Storm type
Season summary provided by NOAA of the 2006 Atlantic hurricane season.
Hurricane Florence is the sixth named storm of the 2006 Atlantic Hurricane Season. Florence started as a tropical depression north and east of the South American coast, and since forming on September 3, it has grown in power and size only very gradually. As of September 11, 2006, it had become a Category One hurricane. It was not predicted to make landfall, but it had been brushing against Bermuda, not passing directly over the island, but bringing powerful winds, rain, and strong storm-generated surf as it passed as close as 100 kilometers (60 miles) from the island, according to the Reuters news wire.
This photo-like image was acquired by the Moderate Resolution Imaging Spectroradiometer (MODIS) on the Terra satellite on September 11 2006, at 11:05 a.m. local time (15:05 UTC). Hurricane Florence at the time of this image was a large spiral open swirl spread over a wide area of the Atlantic Ocean. Florence had sustained winds of around 145 kilometers per hour (90 miles per hour) at the time this satellite image was acquired, according to The University of Hawaii’s Tropical Storm information center.
The high-resolution image provided above is provided at the full MODIS spatial resolution (level of detail) of 250 meters per pixel. The MODIS Rapid Response System provides this image at additional resolutions.Track map of Hurricane Florence of the 2006 Atlantic hurricane season. The points show the location of the storm at 6-hour intervals. The colour represents the storm's maximum sustained wind speeds as classified in the (see below), and the shape of the data points represent the nature of the storm, according to the legend below.
Storm type
Unnamed Tropical Storm on July 17 at approximately 1653 UTC. This image was produced from data from NOAA-18, provided by NOAA. The storm's maximum sustained winds were near 50 mph at the time this image was taken.
The 2006 Atlantic Hurricane season had a slow start, with very few named storms in the first months of the season. But in early September, the previously hurricane-less season threw out four hurricanes in a row. The first two hurricanes were both short-lived relative weak Category One hurricanes, Ernesto and Florence. But the season shifted into high gear as Florence was spinning down in the North Atlantic in mid-September. Hurricanes Gordon and Helene formed in quick succession, both reaching Category Three strength a few days from each other. However, only Ernesto amongst these four hurricanes made landfall; a persistent ridgeline of high pressure over the U.S. east coast steered storms away into the North Atlantic. Florence, Gordon, and Helene have each been steered north well away from the coastland mainland, though Florence did bring strong winds, heavy rain, and storm surge to Bermuda. As of September 19, it appeared that Gordon would continue to pull away to the north and east without passing near Bermuda, and early concerns that Helene might strike the island have been revised, and this powerful hurricane was also expected to arc away to the north well away from the island.
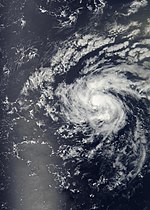
This photo-like image was acquired by the Moderate Resolution Imaging Spectroradiometer (MODIS) on NASA’s Aqua satellite on September 18, 2006, at 12:45 p.m. local time (16:45 UTC). Helene was a well-defined hurricane spiral in this image, with tightly wound central portions, complete eyewall around the storm center, and possessing a well-defined cloud-filled eye. At the time of this image, according to the University of Hawaii’s Tropical Storm Information Center, Helene had sustained winds of 185 km/hr (115 mph), making it a powerful Category Three storm. While the hurricane was not expected to cross any land in the coming days, Helene would most likely continue to track westerly and arc up north, staying over warmer seas and building power slightly or at least sustaining its Category Three status.Tropical Storm Debby formed near the Cape Verde Islands off the west African coast on August 21, 2006. Within a day, it had become organized enough to be classified as a tropical storm and get named as the fourth storm of the 2006 Atlantic Season, Tropical Storm Debby. As of August 24, 2006, Tropical Storm Debby was making its way through the central Atlantic and poses no immediate threat to any land areas. It is known as a Cape Verde storm because of its formation in the far eastern Atlantic near to the Cape Verde Islands.
This photo-like image was acquired by the Moderate Resolution Imaging Spectroradiometer (MODIS) on the Terra satellite on August 24 2006, at 10:35 a.m. Tropical Storm Debby at the time of this image was a small and not particularly power storm system, though it did possess a well-defined round shape and basic if loose spiral arm structure. Tropical Storm Debby had sustained winds of around 75 kilometers per hour (45 miles per hour), according to the University of Hawaii’s Tropical Storm information center.Track map of Unnamed Tropical Storm of the 2006 Atlantic hurricane season. The points show the location of the storm at 6-hour intervals. The colour represents the storm's maximum sustained wind speeds as classified in the (see below), and the shape of the data points represent the nature of the storm, according to the legend below.
Storm type
Icône représentant une dépression tropicale, selon le code de couleurs de la section Cyclone. Icon for an tropical depression, using the colors from the Cyclone section.
Créé par / created by User:The Shadow KnowsTrack map of Hurricane Helene of the 2006 Atlantic hurricane season. The points show the location of the storm at 6-hour intervals. The colour represents the storm's maximum sustained wind speeds as classified in the (see below), and the shape of the data points represent the nature of the storm, according to the legend below.
Storm type
Track map of Tropical Storm Chris of the 2006 Atlantic hurricane season. The points show the location of the storm at 6-hour intervals. The colour represents the storm's maximum sustained wind speeds as classified in the (see below), and the shape of the data points represent the nature of the storm, according to the legend below.
Storm type
Track map of Tropical Storm Alberto of the 2006 Atlantic hurricane season. The points show the location of the storm at 6-hour intervals. The colour represents the storm's maximum sustained wind speeds as classified in the (see below), and the shape of the data points represent the nature of the storm, according to the legend below.
Storm type
Track map of Hurricane Isaac of the 2006 Atlantic hurricane season. The points show the location of the storm at 6-hour intervals. The colour represents the storm's maximum sustained wind speeds as classified in the (see below), and the shape of the data points represent the nature of the storm, according to the legend below.
Storm type
Track map of Tropical Storm Debby of the 2006 Atlantic hurricane season. The points show the location of the storm at 6-hour intervals. The colour represents the storm's maximum sustained wind speeds as classified in the (see below), and the shape of the data points represent the nature of the storm, according to the legend below.
Storm type
