Atlantiska orkansäsongen 2005
| Första system: | 8 juni, 2005 | ||||||
| Sista system: | 6 januari, 2006 | ||||||
| Antal namngivna stormar: | 28 | ||||||
| Antal orkaner: | 15 | ||||||
| Antal större orkaner (Kat 3+): | 7 | ||||||
| Starkaste stormen: | Orkanen Wilma - 882 mbar (hPa) (26.06 inHg), 295 km/h | ||||||
| Total kostnad: | $128 miljarder (~768 miljarder kr) | ||||||
| Bekräftade dödsfall: | 2,280 | ||||||
| Totalt | |||||||
|---|---|---|---|---|---|---|---|
| 1 | 12 | 7 | 1 | 2 | 1 | 4 | 28 |
| Atlantiska orkansäsonger 2003 2004 2005 2006 2007 | |||||||
Den atlantiska orkansäsongen 2005 pågick officiellt från den 1 juni 2005 till den 30 november 2005 (dock uppkom två ytterligare namngivna cykloner; TS Epsilon som var aktiv mellan 29 november och 9 december 2005, och TS Zeta mellan 30 december 2005 och 7 januari 2006). Historiskt sett bildas de allra flesta tropiska cyklonerna under denna period på året. Atlantiska orkansäsongen 2005 blev den överlägset värsta under 2000-talets första decennium, och innehöll exempelvis 27 namngivna tropiska cykloner (plus en subtropisk storm) varav fyra av dem nådde högsta kategorin (Emily, Katrina, Rita samt rekordorkanen Wilma).
Stormar
Tropiska stormen Arlene
| ||||
|---|---|---|---|---|
| ||||
| Period | 8 juni–13 juni | |||
| Intensitet | 110 km/h (30 m/s) 989 mbar (29.22 inHg) | |||
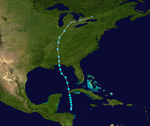
Tropiska stromen Arlene formades nära Honduras den 8 juni och drev norrut. Den korsade västra Kuba den 10 juni och ökade till just under orkanstyrka innan den drev in över Florida nästa dag. Arlene försvagades när den fortsatte norrut över USA. Endast en person dödades i samband med Arlene och endast mindre skador har rapporterats.
Tropiska stormen Bret
| ||||
|---|---|---|---|---|
| ||||
| Period | 28 juni–29 juni | |||
| Intensitet | 65 km/h (20 m/s) 1002 mbar (29.6 inHg) | |||
Tropiska stormen Bret var en kortlivad storm, som endast varade under 24 timmar mellan 28 och 29 juni.
Orkanen Cindy
| ||||
|---|---|---|---|---|
| ||||
| Period | 3 juli–7 juli | |||
| Intensitet | 120 km/h (35 m/s) 991 mbar (29.28 inHg) | |||
Orkanen Cindy var en tropisk cyklon som i korthet utvecklades till en kategori 1 orkan i Mexikanska golfen och nådde land vid Louisiana, USA. Cindy formades officiellt den 3 juni precis öster om Yucatánhalvön.
Orkanen Dennis
| ||||
|---|---|---|---|---|
| ||||
| Period | 4 juli–13 juli | |||
| Intensitet | 240 km/h (65 m/s) 930 mbar (27.47 inHg) | |||
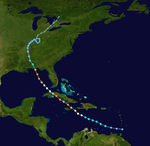
Orkanen Dennis bildades i de sydöstra Karibiska havet och nästan direkt gjorde landkänning på Grenada som tropiskt lågtryck med vindar på 48 km/h. På morgonen den 5 juli ökade den till en tropisk storm.
På eftermiddagen den 6 juli utvecklades stormen till en tropisk orkan samtidigt som den avancerade mot Hispaniola. Nu var stormen en kraftfull och välorganiserad kategori 1-orkan. Efterföljande dag ökade orkanen snabbt i styrka, till en kategori 4-orkan. Då började orkanen röra sig i en mer nordlig kurs, mot Jamaica och Kuba. När den närmade sig Kuba stärktes dess styrka till just under en kategori 5-orkan.
Den 7 juli hamnade orkanen mellan Jamaica och Kuba, och hade landkänning nära Punta dal Inglés med vindar på 220 km/h sent den dagen men strax därefter nedgraderades till en kategori 3-orkan. Den ökade dock i styrka igen och den 8 juli slog den till mot syd-centrala Kuba, åter med vindar på 220 km/h. När Dennis rörde sig över bergen stördes dock dennes cirkulationssystem, och minskade i styrka så pass att den blev en kategori ett-orkan. Den fortsatte dock att uppmärksammas, då den kunde utveckla sig till en kategori fyra-orkan igen.
På morgonen den 10 juli ökade den till en kategori fyra-orkan igen. Orkanen fortsatte att röra sig norrut och hotade nu USA:s sydkust. Varningar utfärdades för Florida Panhandle, Alabama och Mississippi med befaraden att orkanen skulle träffa med nästan full styrka sen eftermiddag, men orkanen minskade då i styrka just före landkänning till en kategori tre-orkan.
Orkanen förlorade sedan styrka under dagen, och dog slutligen ut över Ontario den 13 juli.
Orkanen Emily
| ||||
|---|---|---|---|---|
| ||||
| Period | 10 juli–21 juli | |||
| Intensitet | 260 km/h (70 m/s) 929 mbar (27.44 inHg) | |||
Orkanen Emily drog fram över Karibiska havet och Mexikanska golfen och slutligen nådde Mexikos östkust nära gränsen till Texas. Orkanen Emily gjorde landfall två gånger, dels vid Yucatánhalvön och samt i nordöstra Mexiko. Lyckligtvis skedde inte detta under den mest intensiva fasen vilket minskade skadeverkningarna. Orkanen dödade ändå 15 människor och orsakade skador för cirka 550 miljoner dollar.
Tropiska stormen Bret
| ||||
|---|---|---|---|---|
| ||||
| Period | 21 juli–29 juli | |||
| Intensitet | 110 km/h (30 m/s) 997 mbar (29.45 inHg) | |||
Tropiska stormen Franklin formades över Bahamas den 21 juli och drev oberäkneligt norrut, drev in över Bermuda den 26 juli. Franklin ökade i styrka nära Newfoundland den 30 juli, innan den uppsögs in i ett annat system. Det blev endast smärre skador på land och inga dödsfall rapporterades.
Tropiska stormen Gert
| ||||
|---|---|---|---|---|
| ||||
| Period | 23 juli–25 juli | |||
| Intensitet | 75 km/h (20 m/s) 1005 mbar (29.69 inHg) | |||
Som ett tropiskt åskväder (det som får tropiska cykloner att bildas) korsade Gert Honduras och Yucatánhalvön innan den bildades till det sjunde namngivna tropiska lågtrycket den 23 juli vid Campeche bukten. Gert uppgraderades till en tropisk storm tidigt nästa dag och ökade i styrka precis innan den nådde land vid Tampico, med maxvindar på 70 km/h och minsta lufttrycket på 1005 mbar. Gert fortsatte in över Mexiko innan den avmattades dagen efter.
Tropiska stormen Harvey
| ||||
|---|---|---|---|---|
| ||||
| Period | 2 augusti–8 augusti | |||
| Intensitet | 100 km/h (30 m/s) 994 mbar (29.36 inHg) | |||
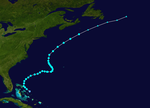
Tropiska stormen Harvey formades sydväst om Bermuda den 2 augusti och passerade nära Bermuda den 4 augusti med stora skyfall. Efter att Harvey hade fortsatt sin bana öster ifrån Bermuda nådde den sin topp innan den senare svängde nordost. Harvey ökade igen den 8 augusti och klarade sig några dagar till i atlanten.
Externa länkar
Media som används på denna webbplats
Tropical Storm Arlene making landfall at 1645 UTC, as seen by the MODIS instrument aboard NASA's Terra satellite.
Track map of Tropical Storm Harvey of the 2005 Atlantic hurricane season. The points show the location of the storm at 6-hour intervals. The colour represents the storm's maximum sustained wind speeds as classified in the (see below), and the shape of the data points represent the nature of the storm, according to the legend below.
Storm type
Season summary provided by NOAA of the 2005 Atlantic hurricane season.
Symbol for a tropical storm in the Northern Hemisphere.
Track map of Tropical Storm Arlene of the 2005 Atlantic hurricane season. The points show the location of the storm at 6-hour intervals. The colour represents the storm's maximum sustained wind speeds as classified in the (see below), and the shape of the data points represent the nature of the storm, according to the legend below.
Storm type
Hurricane Cindy was preparing to make landfall over southeastern Louisiana on July 5, 2005, when the Moderate Resolution Imaging Spectroradiometer (MODIS) on NASA’s Aqua satellite captured this image. At the time, National Hurricane Center reported the storm to have winds of 70 miles per hour, just 4 miles per hour under hurricane status. After coming ashore near the mouth of the Mississippi River, Cindy moved northeast, drenching Alabama with rain. Though the storm left thousands without power and triggered some flooding, no serious damage has been reported.
The large image provided above is at MODIS’ maximum resolution of 250 meters per pixel. The MODIS Rapid Response Team provides the image in additional resolutions.Track map of Hurricane Cindy of the 2005 Atlantic hurricane season. The points show the location of the storm at 6-hour intervals. The colour represents the storm's maximum sustained wind speeds as classified in the (see below), and the shape of the data points represent the nature of the storm, according to the legend below.
Storm type
Hurricane Dennis was bearing down on the Gulf Coast of the United States on July 10, 2005, at 12:15 p.m. (16:15 UTC) when the Moderate Resolution Imaging Spectroradiometer on NASA's Terra satellite captured this image. With winds of 140 miles per hour (225 kph), Dennis was a powerful Category 4 storm just hours away from making landfall. At the time this image was taken, the eye of the storm was about 55 miles (90 kilometers) south, southeast of Pensacola, Florida, and the storm was moving northwest at about 18 miles per hour (29 kph).
The size of the storm put clouds of rain over most of the southeastern United States well before the storm came ashore. In this image, Dennis covers all of Florida, Alabama, Mississippi, and stretches over parts of Louisiana. The northern fringes of the storm appear to be over Tennessee and North Carolina.
For additional information and warnings about this storm, please visit the National Hurricane Center. This image is available in additional resolutions from the MODIS Rapid Response Team.Hurricane Emily was spinning through the Caribbean south of Jamacia on July 16, 2005, when the Moderate Resolution Imaging Spectroradiometer (MODIS) on the Terra satellite captured this image at 15:45 UTC (11:45 a.m. Eastern Daylight Time). At this time, Emily was a well-developed hurricane with winds over 230 kilometers an hour (125 knots) and gusts as high as 285 km/hr (155 knots).
As shown in this satellite image, the storm is passing roughly east to west well south of Jamaica (around 160 kilometers, or 100 miles), but the heavy rains in the storm's outer bands fell on an already sodden island still recovering from Hurricane Dennis, which similarly glanced the island on July 7. Emily's rains caused flooding, which has resulted in four deaths on the island. Tourists in the Yucatan Peninsula are being evacuated from resort areas and beaches as the hurricane continues on track to make landfall there during the morning of July 18, 2005.Track map of Hurricane Emily of the 2005 Atlantic hurricane season. The points show the location of the storm at 6-hour intervals. The colour represents the storm's maximum sustained wind speeds as classified in the (see below), and the shape of the data points represent the nature of the storm, according to the legend below.
Storm type
Track map of Tropical Storm Franklin of the 2005 Atlantic hurricane season. The points show the location of the storm at 6-hour intervals. The colour represents the storm's maximum sustained wind speeds as classified in the (see below), and the shape of the data points represent the nature of the storm, according to the legend below.
Storm type
This image of Tropical Storm Bret was captured at 2245 UTC on June 28 when it was located off the coast of Mexico. At the time, maximum sustained winds were 40 mph and the minimum pressure was 1002 mb.
This image of Tropical Storm Franklin was captured by the MODIS instrument on NASA's Terra satellite at 1545 UTC on July 23, 2005. Franklin's maximum sustained winds were 70 mph at the time and its estimated minimum pressure was 1001 mb.
Icône représentant une dépression tropicale, selon le code de couleurs de la section Cyclone. Icon for an tropical depression, using the colors from the Cyclone section.
Créé par / created by User:The Shadow KnowsTrack map of Tropical Storm Gert of the 2005 Atlantic hurricane season. The points show the location of the storm at 6-hour intervals. The colour represents the storm's maximum sustained wind speeds as classified in the (see below), and the shape of the data points represent the nature of the storm, according to the legend below.
Storm type
Track map of Tropical Storm Bret of the 2005 Atlantic hurricane season. The points show the location of the storm at 6-hour intervals. The colour represents the storm's maximum sustained wind speeds as classified in the (see below), and the shape of the data points represent the nature of the storm, according to the legend below.
Storm type
Tropical Storm Harvey is more remarkable for being the eighth named storm of the Atlantic hurricane season than for any particular hazard it has posed. Harvey is the earliest recorded eighth storm in a season. This and a number of other factors have led forecasters to predict that the 2005 hurricane season may be the most active recorded, with projections calling for three to five more hurricanes (two of the previous eight storms reached hurricane status, Dennis and Emily), as well as a number of tropical storms.
This image shows Tropical Storm Harvey as recorded by the Moderate Resolution Imaging Spectroradiometer (MODIS) on NASA’s Terra satellite at 14:30 UTC (around 10:30 a.m. local time in Bermuda) on August 4, 2005. The storm has formed the characteristic spiral shape of a hurricane, but with winds around 100 kilometers per hour (65 miles per hour), it is not quite hurricane strength. As of August 5, Tropical Storm Harvey was not predicted to make landfall nor become any stronger, though it was forecasted to remain a strong storm in the northern Atlantic for several days.Track map of Hurricane Dennis of the 2005 Atlantic hurricane season. The points show the location of the storm at 6-hour intervals. The colour represents the storm's maximum sustained wind speeds as classified in the (see below), and the shape of the data points represent the nature of the storm, according to the legend below.
Storm type
Tropical Storm Gert (2005) at 1935 UTC on July 24, 2005 shortly before it made landfall in Mexico


