Northern Hemisphere Sea Ice Extent Anomalies-Sep
Författare/Upphovsman:
NSIDC
Kreditera:
original version: http://nsidc.org/data/seaice_index/archives/index.html
2012 though 2017: ftp://sidads.colorado.edu/DATASETS/NOAA/G02135/south/daily/images/2017/09_Sep/
2020: ftp://sidads.colorado.edu/DATASETS/NOAA/G02135/north/monthly/images/09_Sep/N_09_extent_anomaly_plot_hires_v3.0.png
Kort länk:
Källa:
Upplösning:
1727 x 872 Pixel (221180 Bytes)
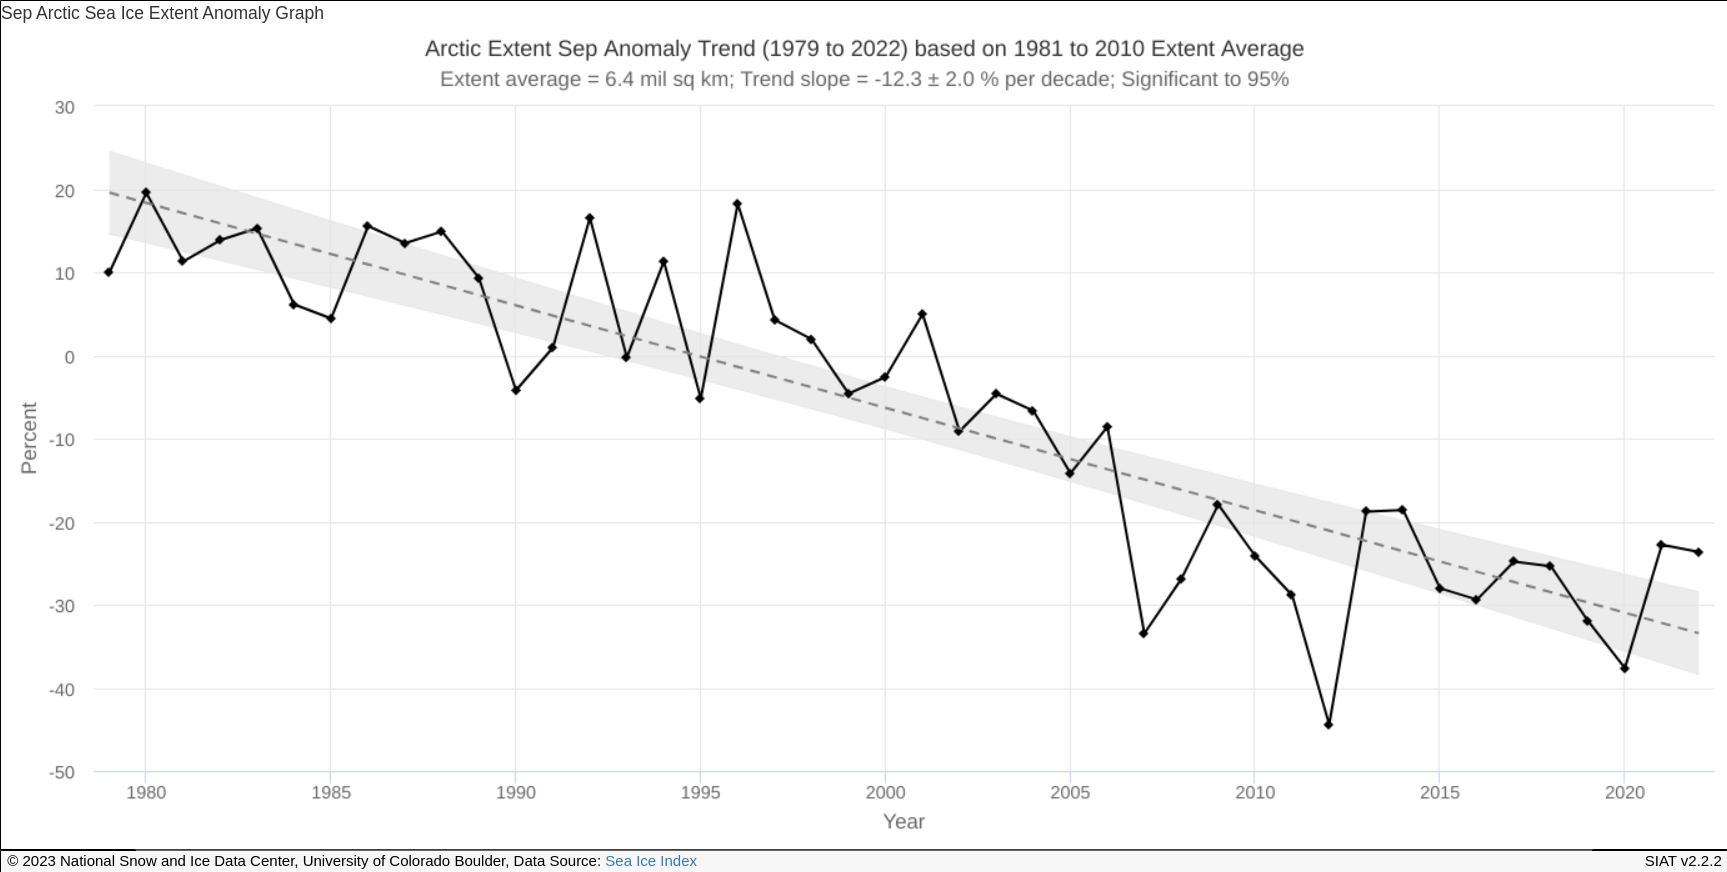
Beskrivning:
Trends in Extent Northern Hemisphere (Arctic) Sea Ice: Ice extent anomalies are plotted as a time series of percent differences between the total extent for the month in question, and the mean for that month, where the mean is based on the January 1981 - December 2010 portion of the data set. The trend, in percent change per decade, is obtained using least squares regression, and a 95% confidence interval for the resulting slope is given.
Licens:
Public domain
Mer information om licensen för bilden finns här. Senaste uppdateringen: Fri, 24 Jan 2025 18:33:50 GMT