NH temperature 2ka
Författare/Upphovsman:
Hanno, based upon the sources quoted above
Tillskrivning:
Bilden är taggad "Attribution Required" men ingen tillskrivningsinformation lämnades. Attributionsparametern utelämnades troligen när MediaWiki-mallen användes för CC-BY-licenserna. Författare och upphovsmän hittar ett exempel för korrekt användning av mallarna här.
Kreditera:
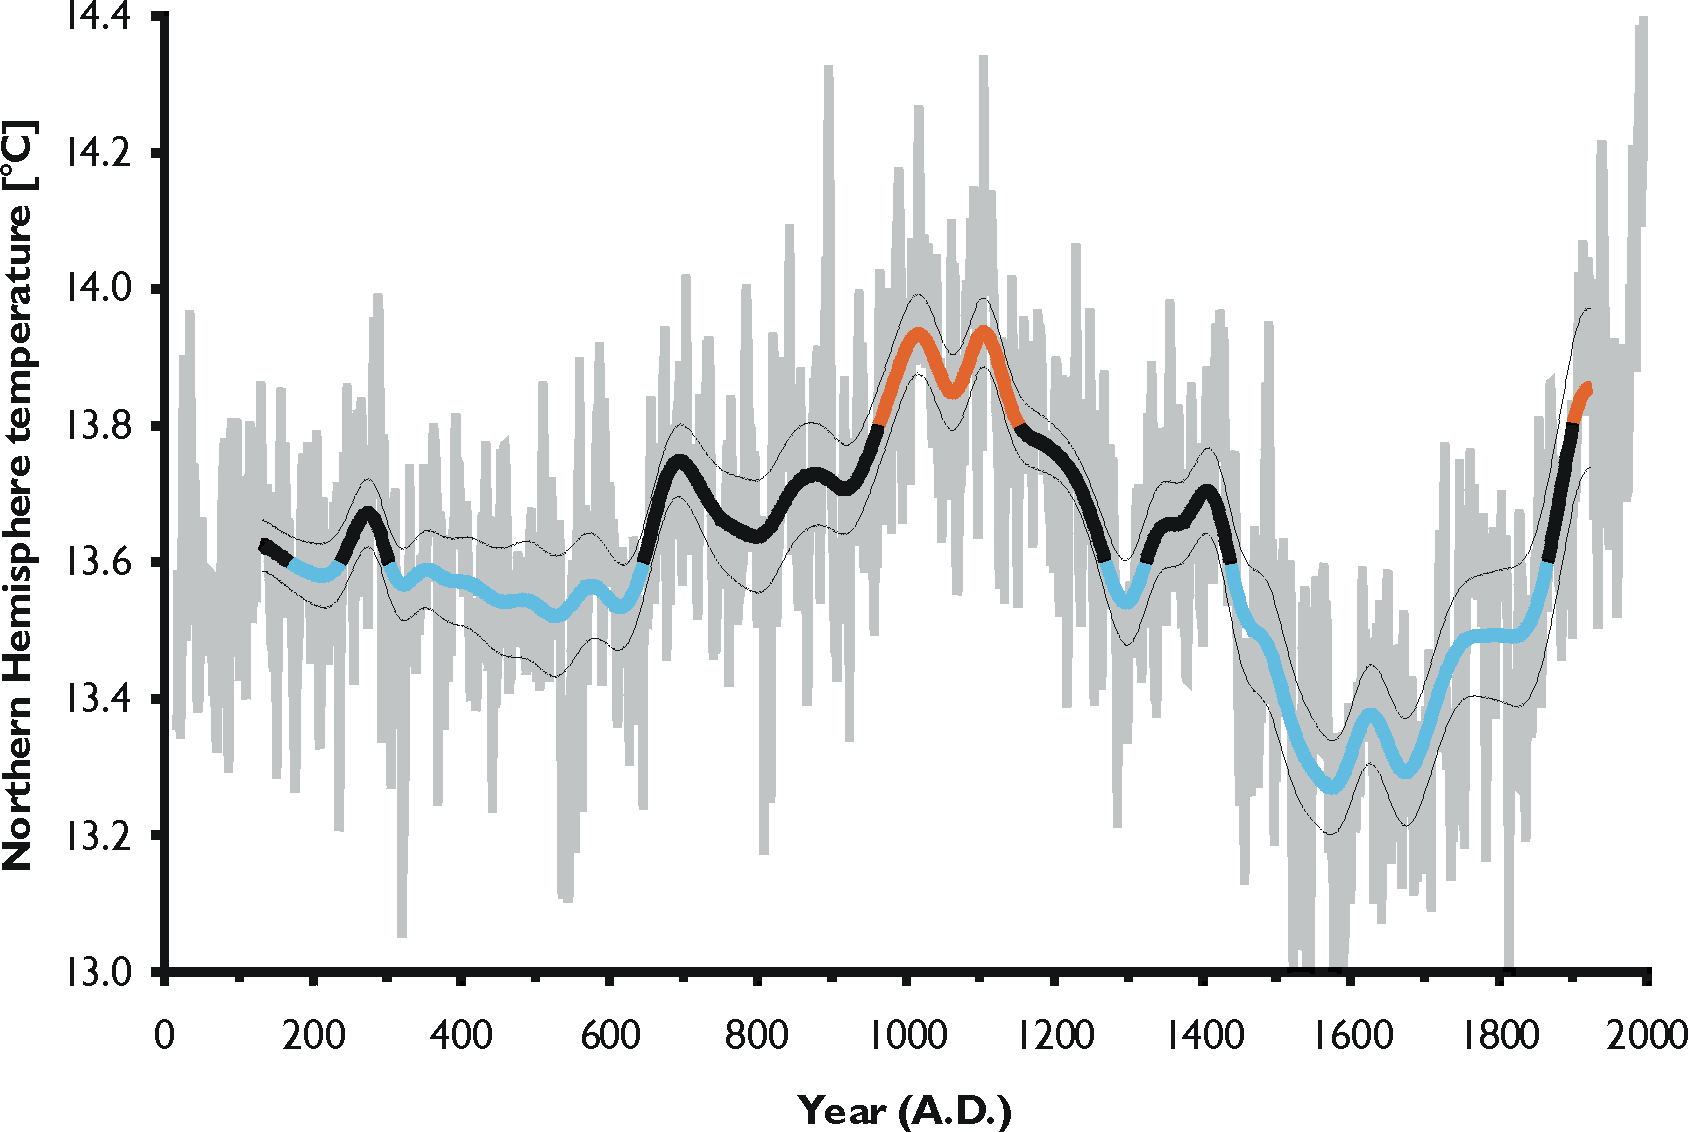
graph drawn by Hanno using data published by A. Moberg, D.M. Sonechkin, K. Holmgren, N.M. Datsenko, W. Karlén, and S.-E. Lauritzen (2005, Highly variable Northern Hemisphere temperatures reconstructed from low- and high-resolution proxy data. Nature (London), 433, 613–617). Temperatures for the last three decades of the 20th Century were taken from P.D. Jones, D.E. Parker, T.J. Osborn & K.R. Briffa (2005, Global and hemispheric temperature anomalies – land and marine instrumental records. In Trends: A Compendium of Data on Global Change. Carbon Dioxide Information Analysis Center, Oak Ridge National Laboratory, U.S.
Kort länk:
Källa:
Upplösning:
1688 x 1132 Pixel (126195 Bytes)
Beskrivning:
Average temperature of the Northern Hemisphere during the past 2000 years. The grey lines are the annual reconstructed estimates. The bold curve is the low frequency component (estimable between 133 and 1925). Colours indicate especially cold and warm periods. (Cold: Migration Period and Little Ice Age; warm: Medieval Warm Period and the Present.) The thin lines are the 95% confidence intervals (uncertainty due to the variance among the different proxies used).
Licens:
Licenskommentaren:
Released under the GNU Free Documentation Licence and the cc-by-sa-2.5 Licence by the originator
Licensvillkor:
Creative Commons Attribution-Share Alike 3.0
Mer information om licensen för bilden finns här. Senaste uppdateringen: Fri, 18 Apr 2025 07:19:15 GMT