Archaeopteryx growth curve
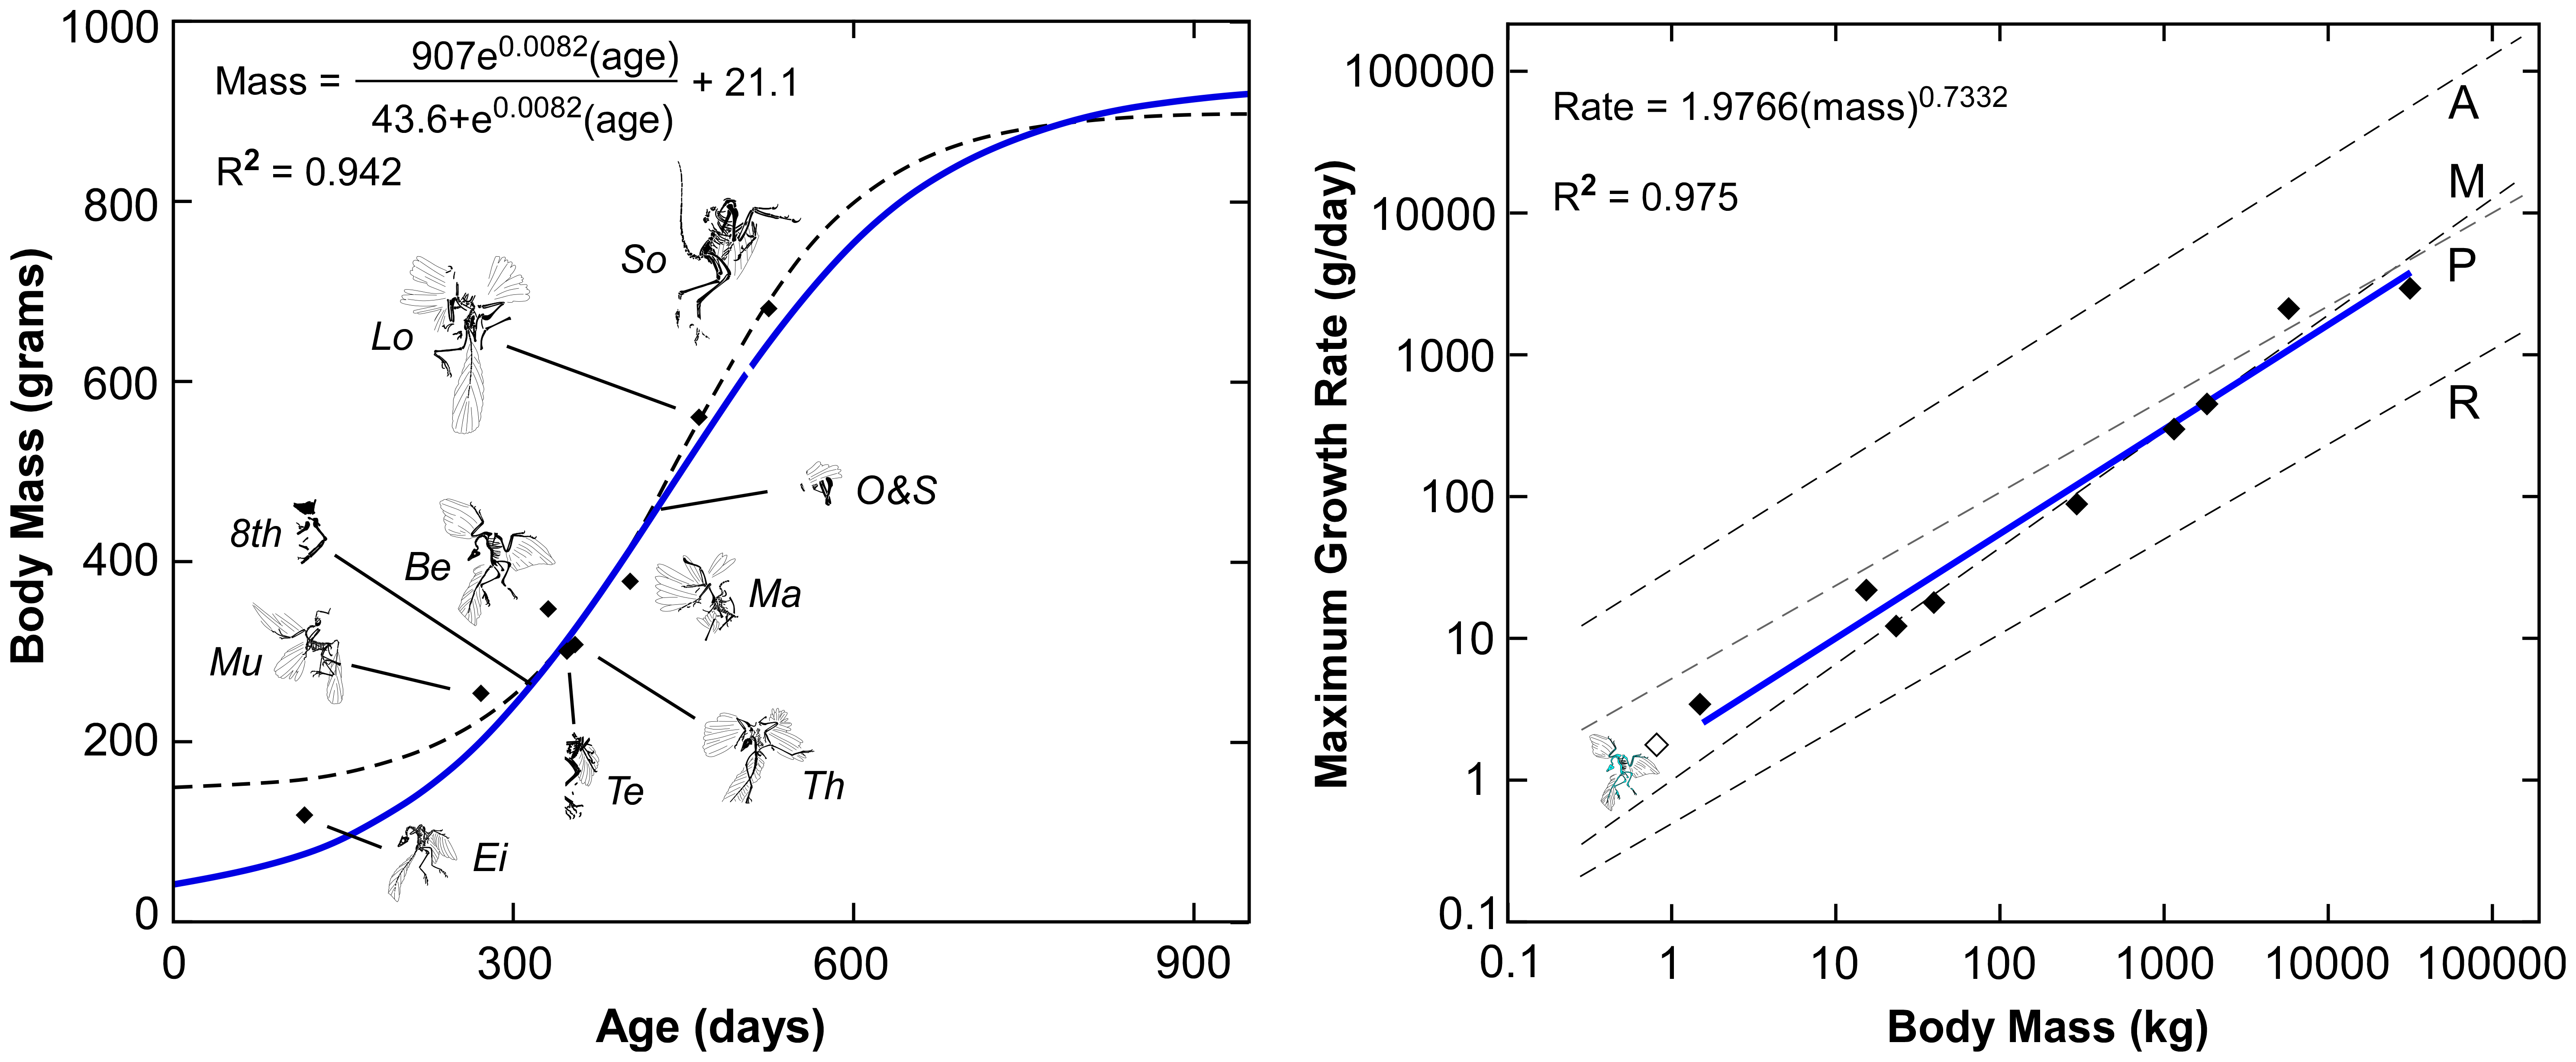
Figure 9. Growth depictions for Archaeopteryx.
(Left) The size and estimated age for all ten specimens are depicted. The growth curves are based upon age and size estimates (diamonds) for the eight specimens where femoral length is known. The dashed line represents the best fit for the unconstrained statistical analysis with hatchling and adult size undefined. The solid line represents the best fit when hatchling and adult size are constrained. (Right) The maximal growth rates from these analyses (1.87–2.2 g/day; hollow diamond) fit expectations (1.83–1.87 g/day; [31]) for same-sized non-avialan dinosaurs (solid line) – animals that grew like slow growing endotherms, here compared to marsupials (M). The Archaeopteryx estimates are three times lower than typical rates for extant precocial land birds (5.7 g/day; P], 15 times lower than altricial land birds (28.6 g/day; A), and four times higher than typical rates for extant reptiles (0.46 g/day; R) [32]. Specimens designations: Ei = Eichstäat, Mu = Munich, 8th = 8th Exemplar, Te = Teyler, Th = Thermopolis, Be = Berlin, Ma = Maxberg, O&S = Exemplar der Familien Ottmann & Steil, Lo = London, So = Solnhofen.
doi:10.1371/journal.pone.0007390.g009Mer information om licensen för bilden finns här. Senaste uppdateringen: Fri, 09 Aug 2024 13:40:47 GMT